
2025 MID-YEAR
Auto liability

Report Objectives
data parameters
Our practice team uses JURIS claims data to perform comparative analyses informed by their expertise and analytics. The data in this report is based on both insured and self-insured claims for all states across five, 12-month periods (referred to as FY) from July 1, 2021, through June 30, 2025.
Key observations
Bodily injury claims became more frequent and complex in FY 2025, especially in high-risk sectors like transportation. Although resolution times improved slightly, the cost of handling claims — particularly those involving litigation — continued to climb. Early legal involvement often signaled future disputes, and while litigated claims were fewer in volume when compared to non-litigated ones, they carried a disproportionate financial burden.
+1.4%
19%
1 DAY
CARRIER
CLAIMS
17%
10.7%
57%
72% had representation in place within 14 days.
15.2%
10.3%
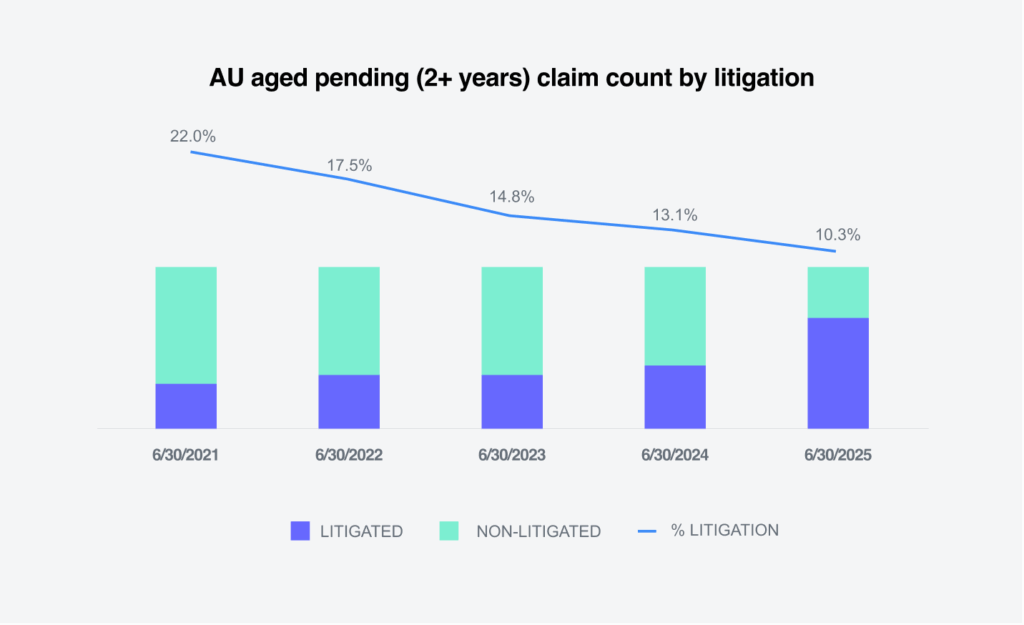
Litigated claims accounted for 63.6% of the total aged pending.
.5%
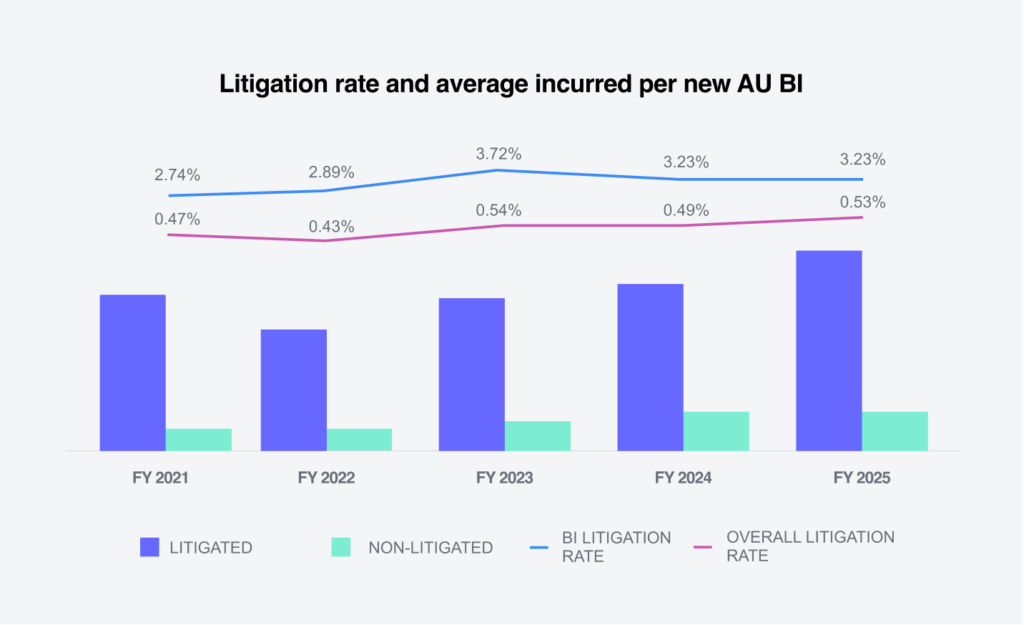
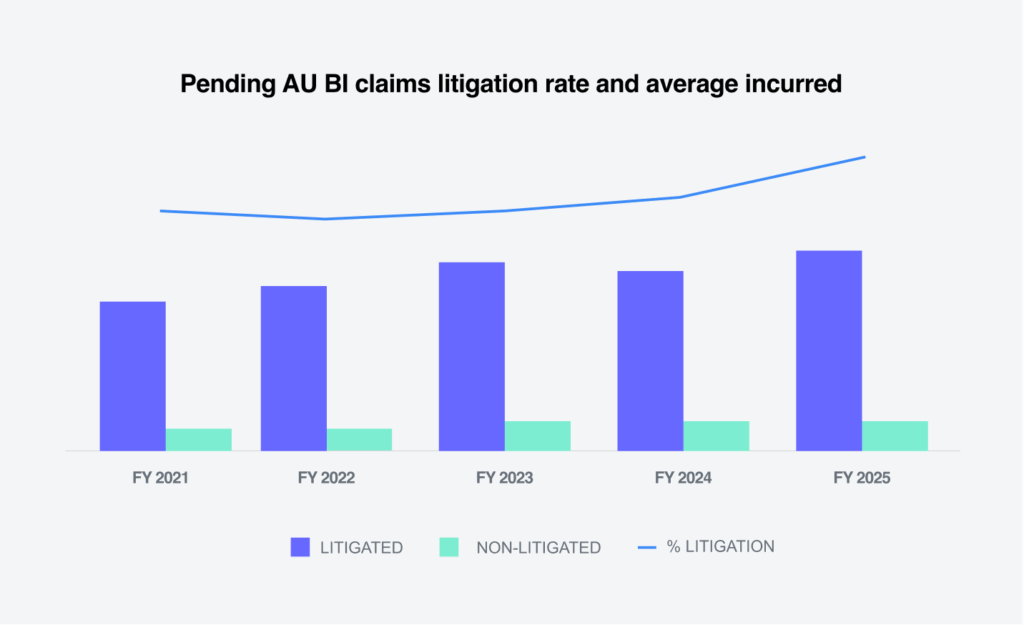
The litigation rate for new bodily injury claims remained flat at 3.2%. The litigation rate for pending bodily injury claims increased to 14%.
$100K+
2%
Download a summary slide with these key observations.
REPORT CONTENTS
REPORT CONTENTS
Market
Repair costs are up
+3.2%
in 2025
CCC Intelligent Solutions Inc., a leading cloud platform provider for the P&C industry, reports in its Crash Course Q2 2025 Report that the primary driver of overall repair cost increases in 2024 and so far in 2025 has been labor rates. These rates were up 3.2% when comparing Q1 2024 to Q2 2025.
CCC also reports that medical inflation is driven by increases in medical billing at the line level, with certain procedures experiencing rapid inflation well in excess of cumulative average increases.
According to Marsh data, in Q1 2025, U.S. casualty insurance rates rose by 8% due largely to severity of claims and large jury verdicts.
Willis Towers Watson’s Insurance Marketplace Realities 2025 Spring Update shows that auto liability continues to be a challenging segment within the casualty insurance market. The market has experienced 34 consecutive quarters of rate increases through Q4 2024.
Volume
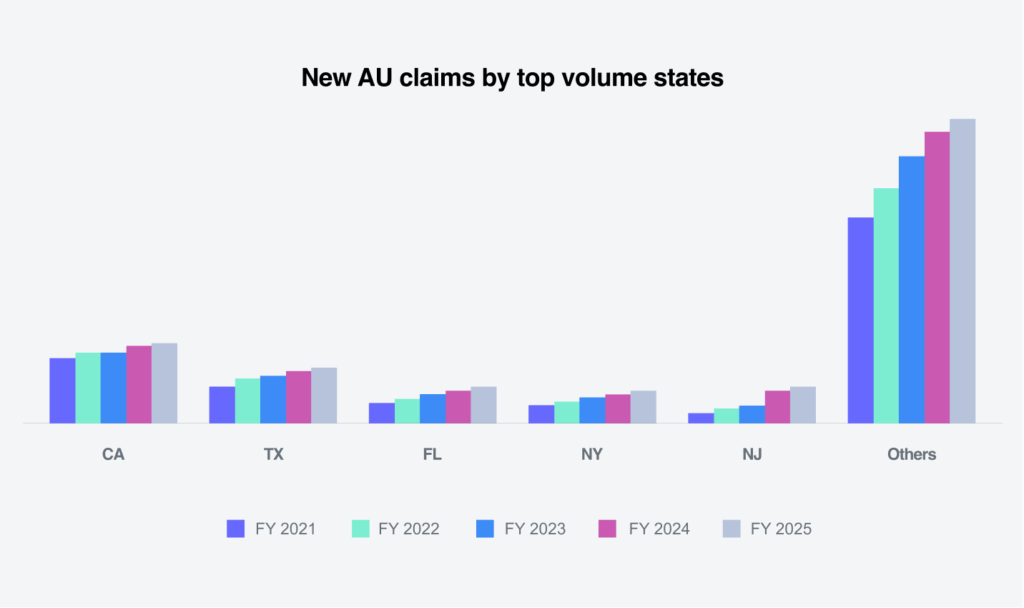
Claim volume increased
+6.1%
in 2025
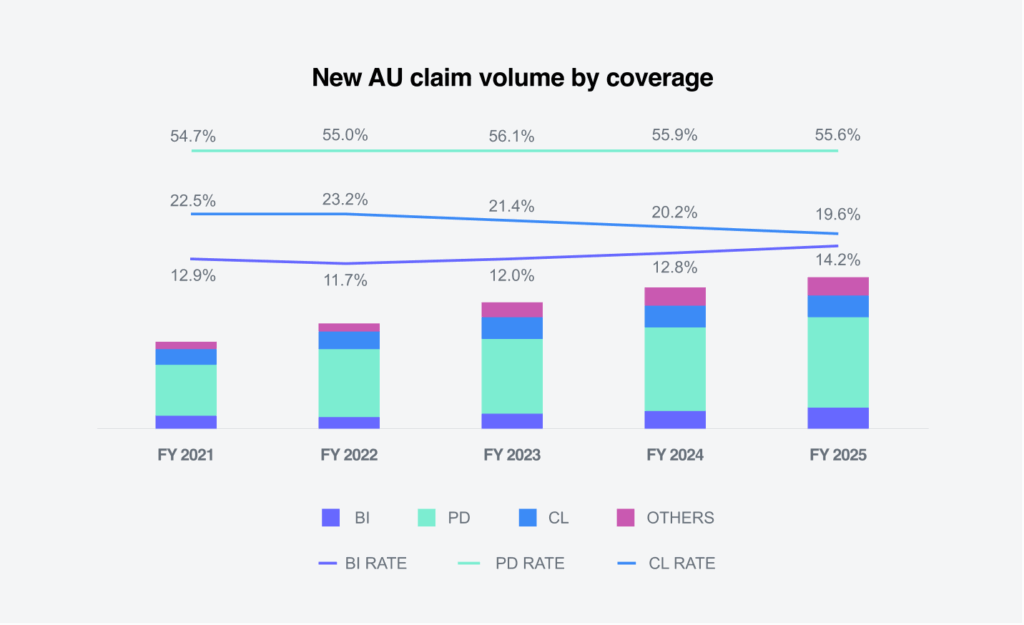
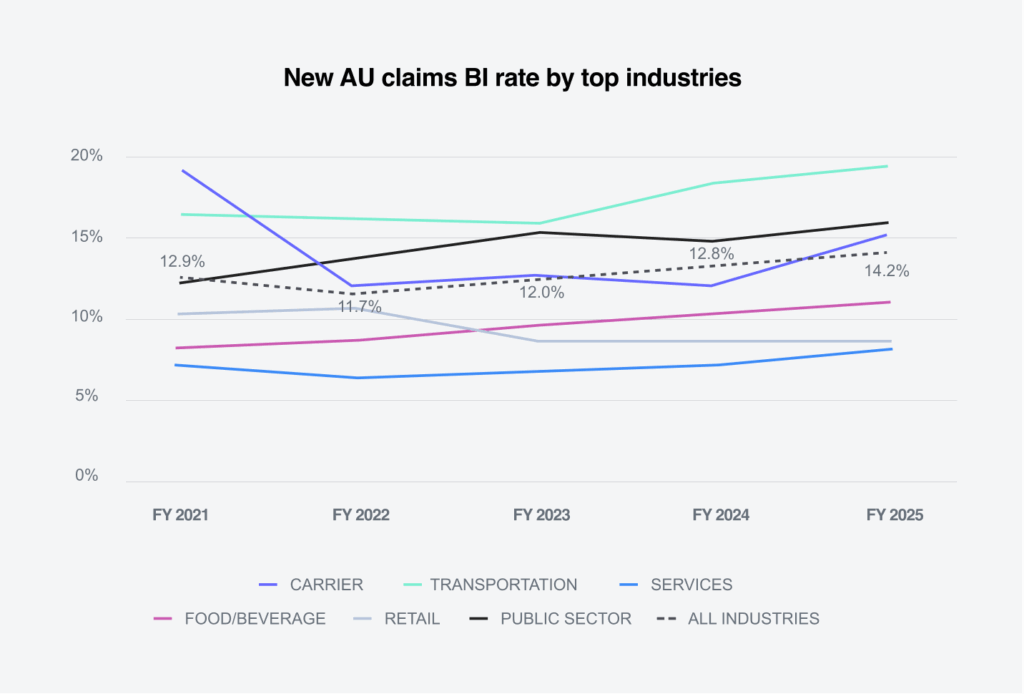
The rate of new bodily injury claims was 14.2% for FY 2025 versus 12.8% in FY 2024 and has increased each year for the past four years. While transportation claims continued to have the highest new bodily injury claim rate at 19%, carrier claims represented the largest percentage increase of 3% by increasing to 15.6%.
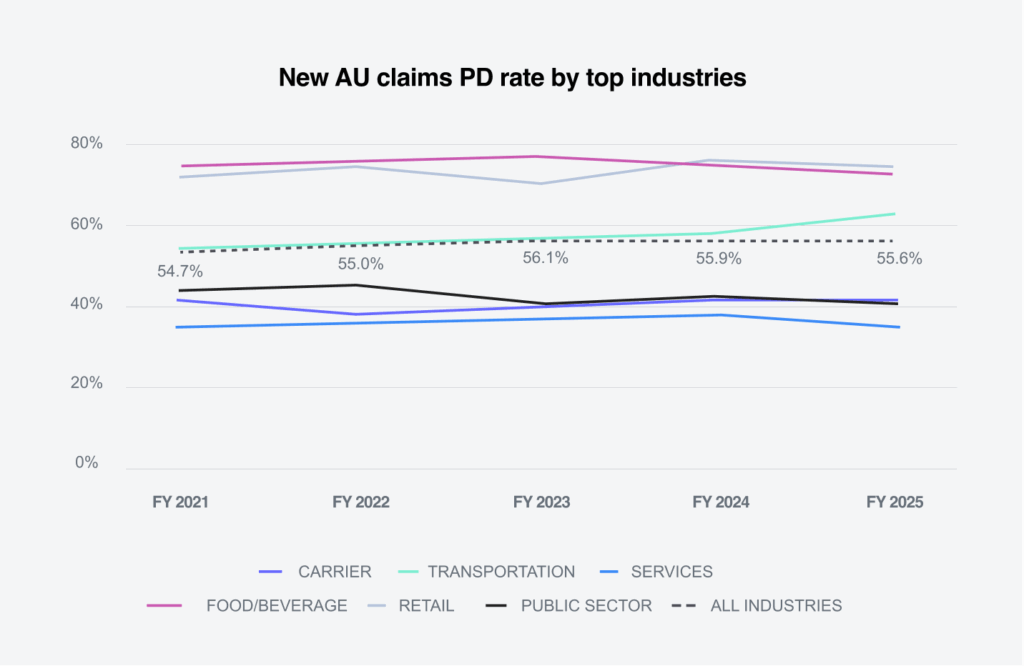
The overall property damage rate declined in FY 2025 to 55.6% from the FY 2024 rate of 55.9%. Only two industry segments saw an increase in their property damage rate: transportation and carrier claims. Transportation claims experienced the greatest increase at 5%, and carrier claims experienced a 0.7% growth in property damage rates.
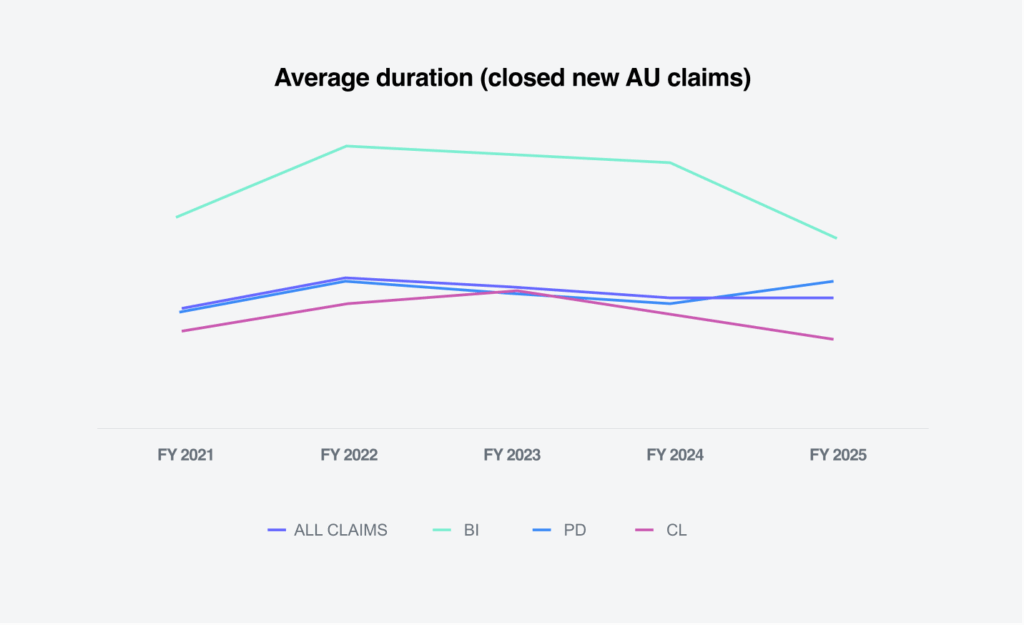
Claim durations continued to decrease for all closed claims, dropping by one day. The decrease was driven by bodily injury claim durations, which dropped by 13 days.
Costs
+17%
in 2025
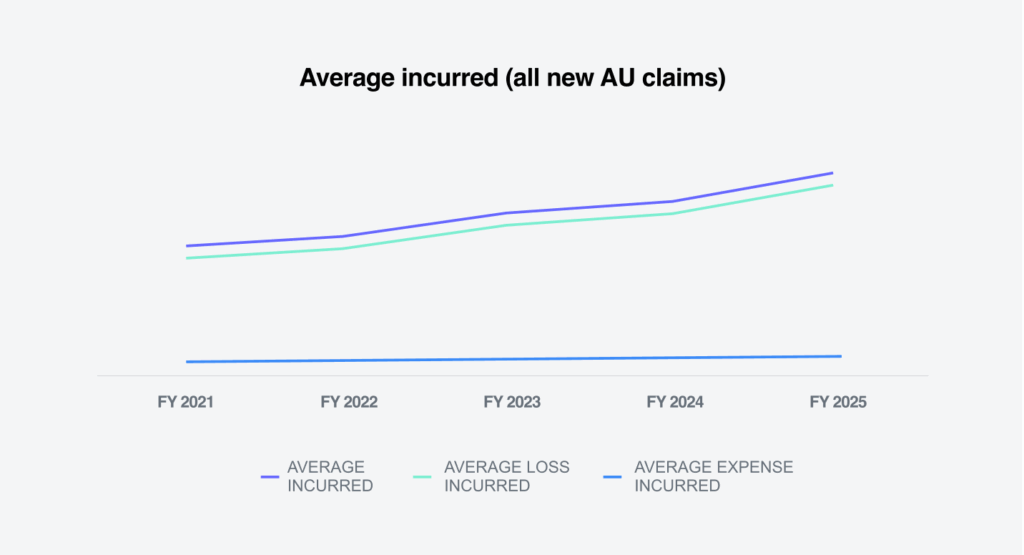
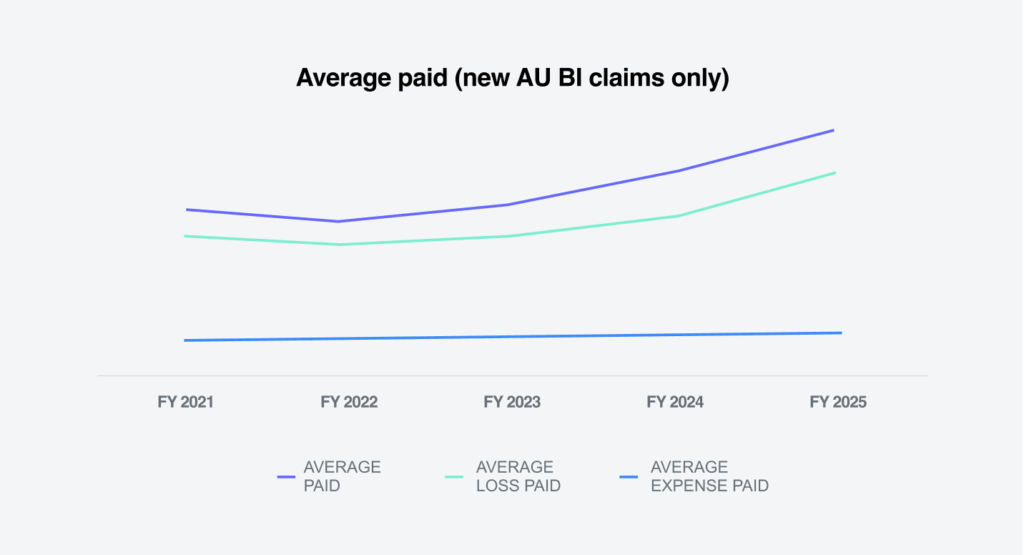
The average incurred for all new claims increased 17% in FY 2025. The average loss incurred in FY 2025 was up 17.2% from last year, and the average expense incurred increased 14.3%. Both loss and expense average incurred have been increasing at an annual average percentage rate of 11.7% since FY 2021.
The higher-tier incurred groups continued to see an increase in the volume of claims, which drove the overall incurred value increase. The $100,000+ stratification increased in volume to 0.5% in FY 2025 from 0.4% in FY 2024. This small volume of claims now represents 23.1% of the overall incurred in FY 2025, which is an increase of less than 0.6% since FY 2024. An even more notable change was in the $25,000-$100,000 stratification, which increased by 1% in volume to represent 34% of the overall incurred (it was 29% in FY 2024).
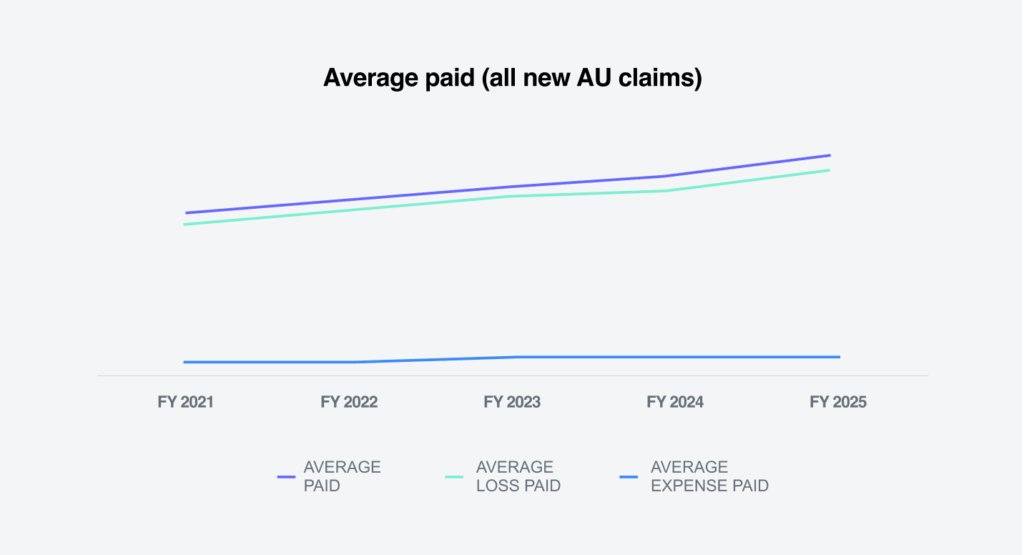
For all new claims, the average paid increased by 6.9%. The increase was driven by bodily injury claims, which are up 23.3% in comparison to FY 2024. The average paid for new claims has been increasing at an annual average percentage rate of 6.8% since FY 2021, while bodily injury claims are increasing at 11.6% per year.
Litigation
57%
Claims with representation within 24 hours
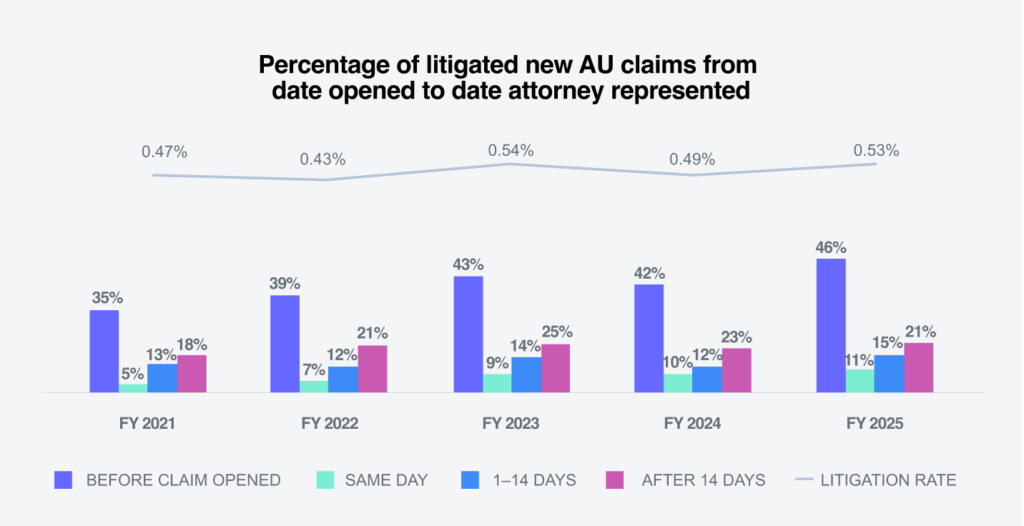
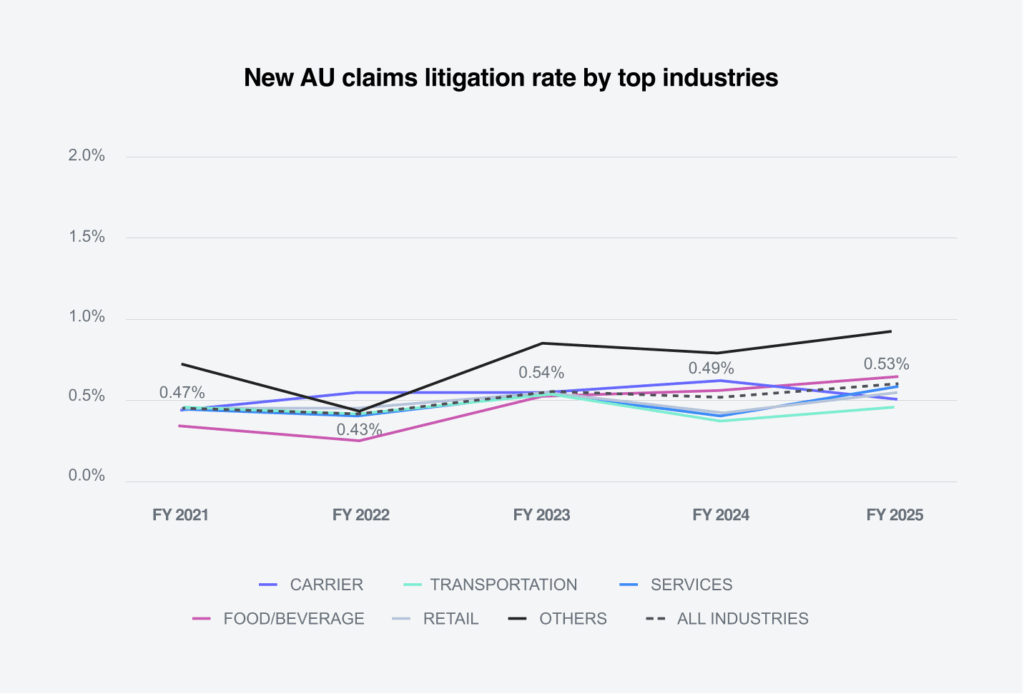
For new claims, the average litigation rate across all industries was 0.5%, which is consistent with the FY 2024 rate. The transportation sector continued to have the highest litigation rate at 0.9%.
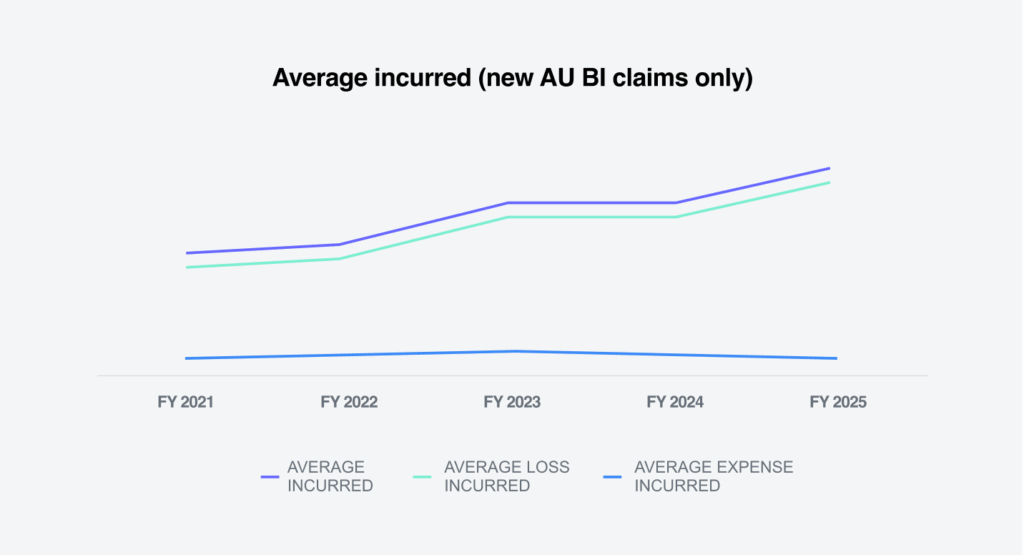
The litigation rate for new bodily injury claims remained flat at 3.2% in comparison to FY 2024. The average incurred on new bodily injury litigated claims increased 15.2%. The average incurred on non-litigated new bodily injury claims also increased by 22.3%. The average incurred on new bodily injury litigated claims was six times greater than non-litigated claims.
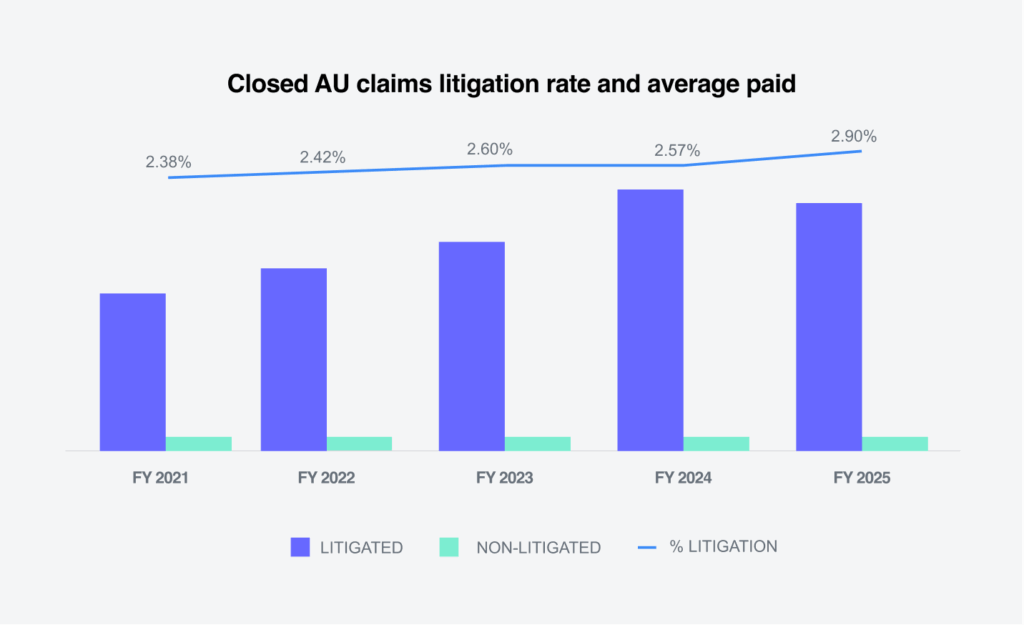
The average paid on closed litigated claims decreased 2.2% but remains 62.2% greater than five years ago. The average paid on closed litigated claims was 34.2 times the amount paid on non-litigated claims, which marked a decrease from FY 2024 (when the ratio was 37.7 times). FY 2025 was the first time in five years the ratio between closed paid litigated to non-litigated decreased. Even though closed litigated claims represented only 2.9% of all closed claims, they accounted for 50.6% of all closed paid amounts.
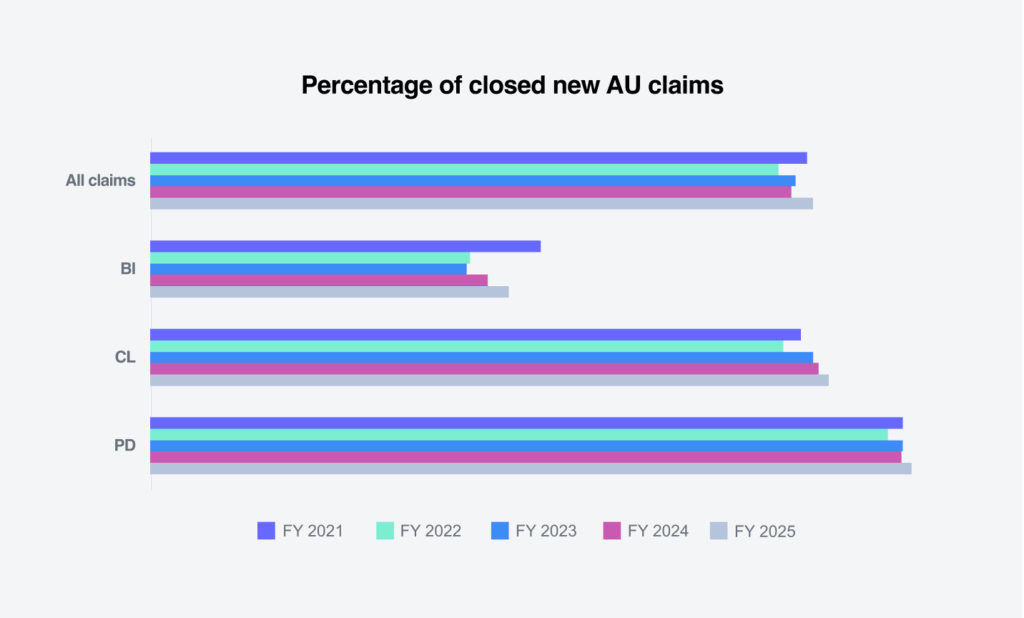
Closings
+1%
Closures for all new claims
Future considerations
Litigated
Non- Litigated
01
02
Attorneys are getting involved in claims much faster than ever and are much more aggressive in soliciting injured parties.
03
Aged pending claims are declining year over year, with a healthy balance of litigated to non-litigated claims.
04
Larger claims ($100,000+) are increasing in frequency and severity.
05
The Insurance Information Institute has identified four common tactics of legal system abuse:
- Aggressive attorney advertising
- Jury anchoring
- Phantom damages
- Third-party litigation funding
Industry concerns
The auto casualty industry continues to be negatively affected by increases in general claim costs and the cost of litigation. The plaintiffs’ bar is leveraging a rising tide of anti-corporate sentiment and psychological tactics to drive disproportionate verdicts across the country. They have been well ahead of the defense industry when it comes to understanding how to wield influence in the courtroom.
Social inflation and nuclear verdicts™
Social inflation continues to rise at levels much faster than general inflation — driven by juror sentiment, an anti-corporate bias and changing societal expectations about who should be responsible for injuries. The plaintiffs’ bar is outpacing the defense industry in leveraging psychological tactics to influence outcomes. They have also successfully leveraged AI to guide case strategy and improve outcomes.
Tort reform
Tort reform activity took the stage in early 2025 with Georgia passing two significant tort reform bills aimed at reducing lawsuit abuse and restoring fairness to the courtroom. Louisiana also passed some needed reforms including switching their tort system to modified comparative, away from pure comparative. Oklahoma successfully passed a bill to reinstate a cap on non-economic damages.
For as many steps forward as tort reform took, there were equal steps made toward broadening tort actions and introducing novel theories of liability. Opponents of tort reform are actively working to deteriorate recently passed reforms with new bills. Businesses providing products and services in areas where these bills are being introduced should familiarize themselves with the proposed laws.
There were opportunities to pass additional tort reforms that were not capitalized on — most notably in Texas, which failed to pass two bills that advocates believe would have benefited their legal environment.
It’s now been two years since Florida’s tort reform package, HB 837, was signed into law, and the legal climate there is starting to show signs of recovery. More time will be needed before we can fully evaluate the utility of the changes.

Attorney representation
Talent crisis
A talent crisis is looming in both the insurance defense and claims adjusting professions. Forbes reports an estimated 400,000 employees are expected to retire from the insurance industry by 2026. As these older professionals depart the workforce, they aren’t being replaced quickly enough. This so-called “retirement cliff’ represents a significant loss of institutional knowledge if insurers cannot augment this with other solutions such as AI.
A recent survey conducted for the 2024 CLM Defense Counsel study found that 90% of respondents said it’s much more difficult to attract and retain talent. Higher caseloads and friction points with carriers and their billing and litigation guidelines were cited as the two most challenging issues. This survey also cites a perception of diminishing expertise level on the part of claims professionals that leaves defense counsel driving more case strategy on their own with less collaboration.
Conclusions
The data from FY 2025 underscores a complex and evolving auto liability landscape.
Despite these pressures, there are signs of progress. Tort reform efforts in several states are beginning to reshape the legal environment, and aged pending claims are declining, suggesting improved claim resolution efficiency. However, the defense industry must remain vigilant and proactive. Understanding the psychological dynamics of juries, countering legal system abuse and adapting to cultural shifts will be critical to maintaining balance and fairness in the courtroom.
As we look ahead, our focus must remain on strategic claims management, data-driven decision-making and advocacy for legal reform. The road forward will require collaboration across stakeholders to ensure that the auto liability system remains equitable, sustainable and responsive to the realities of today’s risk environment.