
2025 MID-YEAR
General liability

Report Objectives
This report aims to summarize the present metrics for our general liability (GL) programs, assess the landscape of GL claims and litigation, and benchmark our patterns against comparable industry research.
data parameters
Our practice team uses JURIS claims data to perform comparative analyses informed by their expertise and analytics. The data in this report is based on both insured and self-insured claims for all states across five, 12-month periods (referred to as FY) from July 1, 2021, through June 30, 2025.
Key observations
General liability claim volume saw a minor increase in FY 2025, driven by growth in bodily injury and property damage claims. The service and retail sectors continued to lead bodily injury rates, while property damage claims surged in the technology and communications sector. Although litigation rates declined for the second year in a row, litigation remains a major cost driver, and average paid for new bodily injury claims rose across several industries.
.7%
Increase in GL claim volume in FY 2025, driven by a 2.6% rise in property damage and 1.8% rise in bodily injury claims
SERVICES & RETAIL
The sectors that continue to lead in bodily injury claim rates, at 57.8% and 49.9% respectively
91.8%
Property damage claims rate held by the technology and communications sector
This far exceeds the industry average of 51.1%.
7.8%
California, New York and Florida had bodily injury claim rates above the national average, with New York increasing 7.8% since FY 2021
TEXAS & GEORGIA
States with the largest growth in new GL claim volume, at 6.5% and 2.5% respectively
5.1%
Increase in average paid for new GL bodily injury claims, with the retail, carrier and public sector categories seeing the largest gains
23%
Decrease in average paid for GL bodily injury claims in Florida, attributed to 2023 tort reforms
.9%
Decrease in litigation rates for new GL claims
This marks the second consecutive year of decline.
> 50%
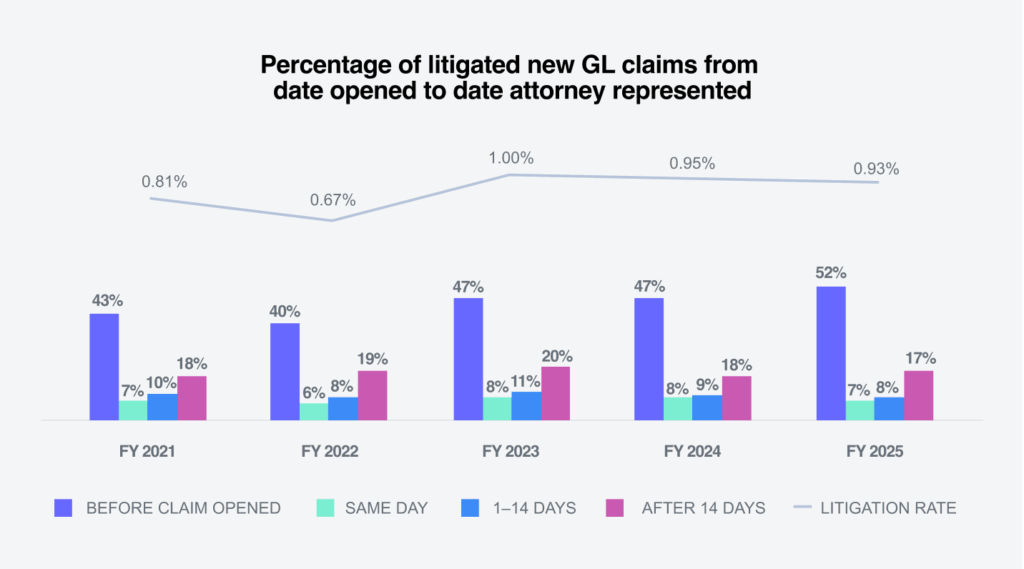
More than half of new GL claims that became litigated had attorney representation before the claim was opened
This represents a 5% increase over FY 2024.
8.4%
Increase in average incurred for litigated GL claims
66%
Closed litigated GL claims represented 5.9% of volume but 66% of paid dollars
20.7%
Decrease in aged pending claims. New York had the greatest number of aged pending claims
Download a summary slide with these key observations.
REPORT CONTENTS
REPORT CONTENTS
Market
>
10%
IN 2025
According to a recent market outlook report from Dominion Risk Advisors, a firm that provides risk management advice for personal and commercial insurance, rate increases have continued in the U.S. GL market, though they are under 10% so far in 2025.
As Business Insurance reports, excessive litigation in the U.S. is what’s driving surging liability insurance rates.
According to Insurance Journal, social inflation continues to be fueled by shifting jury attitudes, nuclear verdicts™, third-party litigation funding and social media influence.
Insurance Journal also reports that jurors and courts are increasingly awarding higher compensation as a reflection of societal demands for fairness, justice and accountability in corporate behavior.
Tort reform legislation, which is picking up support in certain key states, may negatively impact the industry in the short term as plaintiff attorneys scramble to file suits before changes go into effect. However, the long-term impact may be a positive one.
Volume
+.7%
IN 2025
GL claim volume increased slightly at 0.7% overall in FY 2025. This was driven by increases in property damage and bodily injury claims, which were up 2.6% and 1.8%, respectively, over the prior year. The average annual percent change (AAPC) over the last five years was 2.2%.
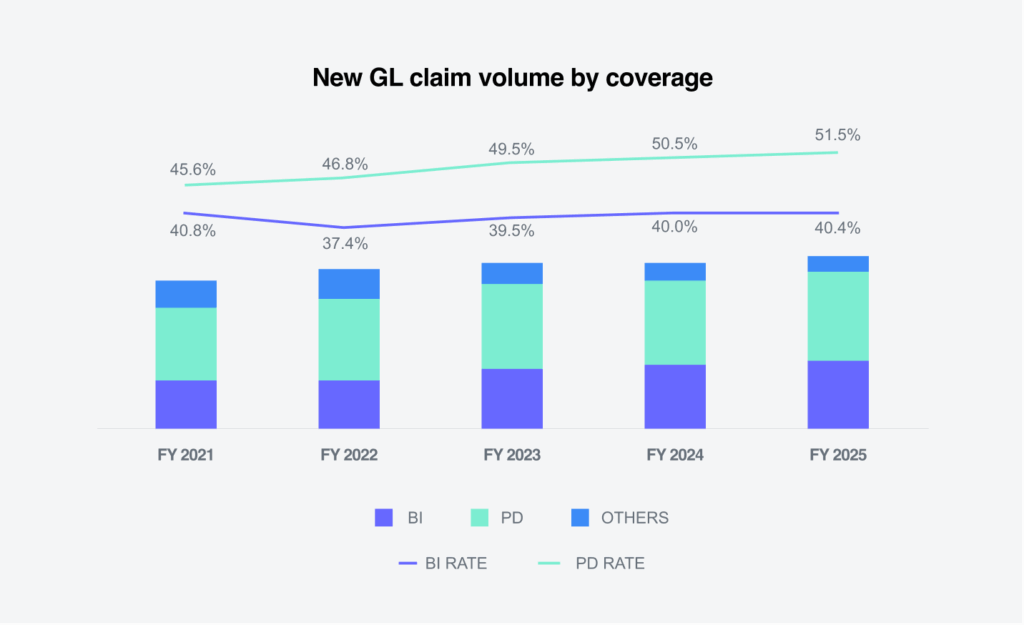
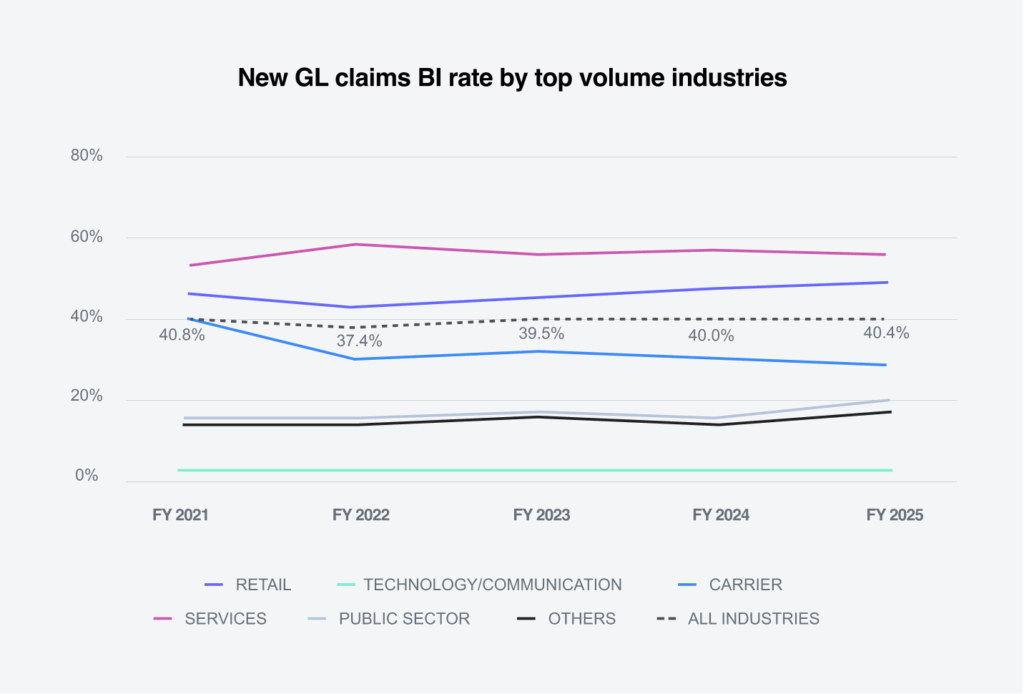
For the third year in a row, the sectors with the highest rates of GL bodily injury claims were the services and retail industries at 57.8% and 49.9%, respectively. The overall average bodily injury claims rate was 40.4%, which increased by 0.4% over FY 2024.
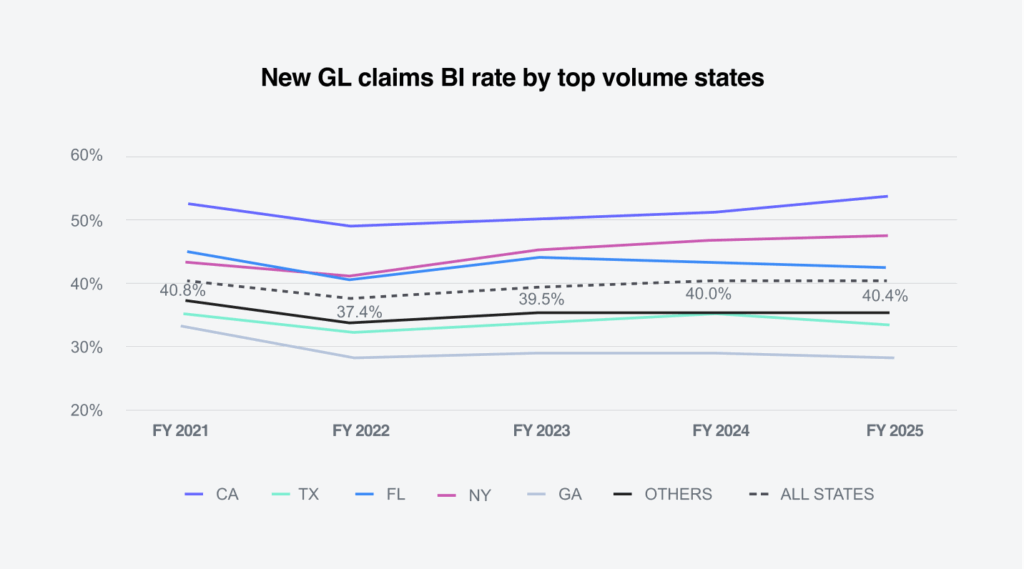
California (52.8%), New York (49.5%) and Florida (46.0%) had new GL bodily injury claim rates above the average for all states (40.4%). New York increased 7.8%, and California increased 6.1% since FY 2021.
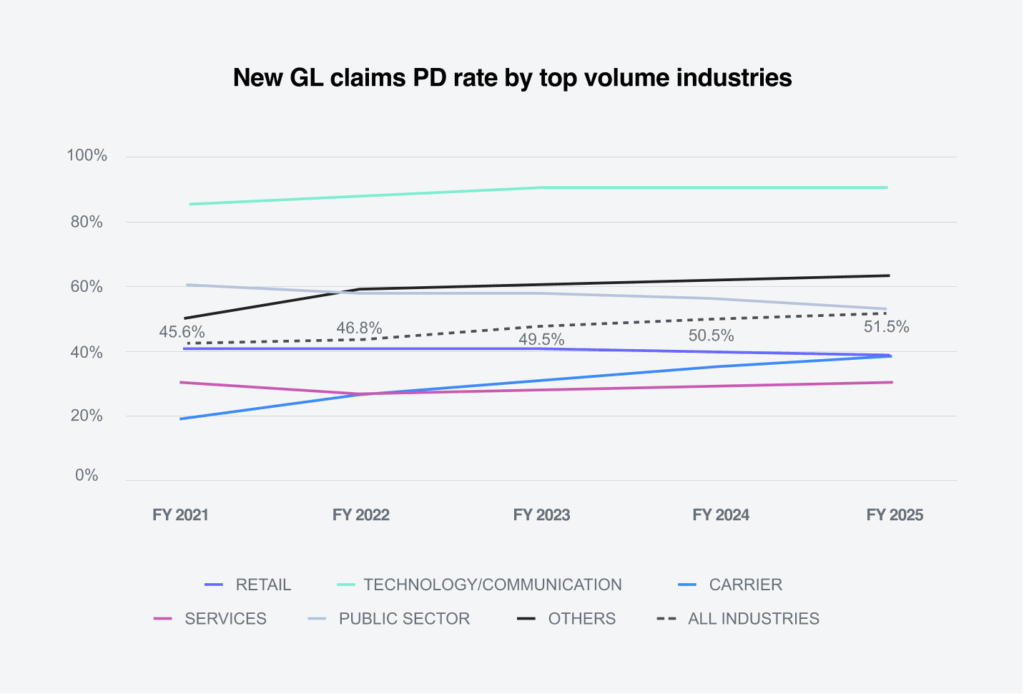
Within the property damage line, the average rate of property damage claims across all industries rose 1% to 51.5% over FY 2024. The technology/communications industry sector increased by 0.3% to 91.8%, far exceeding all other industries and well above the average.
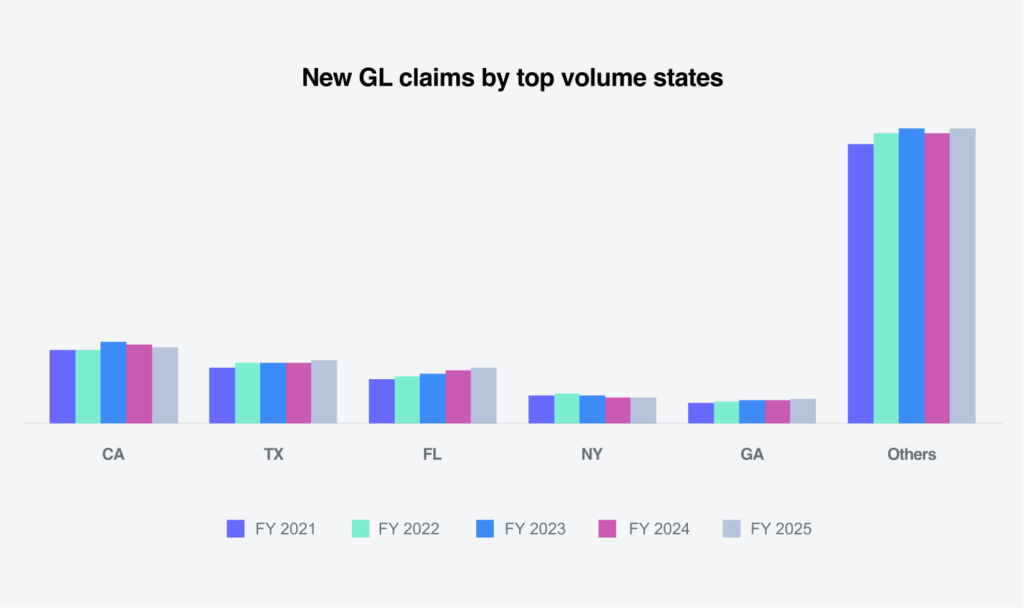
The states with the highest number of new general liability claims were California, Texas, Florida, New York and Georgia. Combined, these five states accounted for 43% of the general liability new claim volume. The two largest states experiencing growth in their new GL claims were Texas (+6.5%) and Georgia (+2.5%).
Costs
Average paid
+.9%
IN 2025
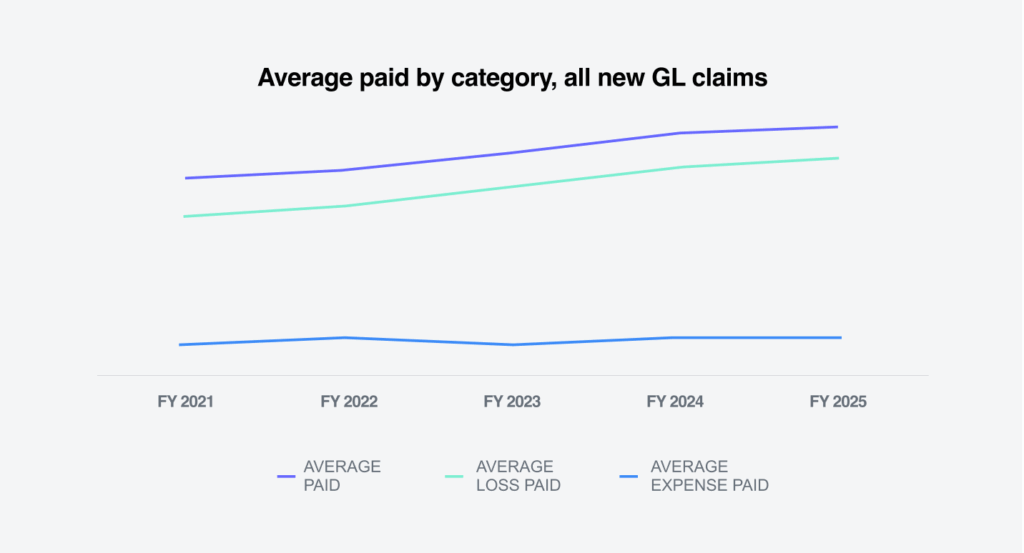
The average paid for all new GL claims increased 0.9%. The average loss paid increased 1.3%, while the average expense paid decreased 1.5%. For bodily injury claims, the average paid increased 5.1%, and the average loss paid also increased 5.1%. The average annual increase in average paid has been 10.1% since FY 2021.

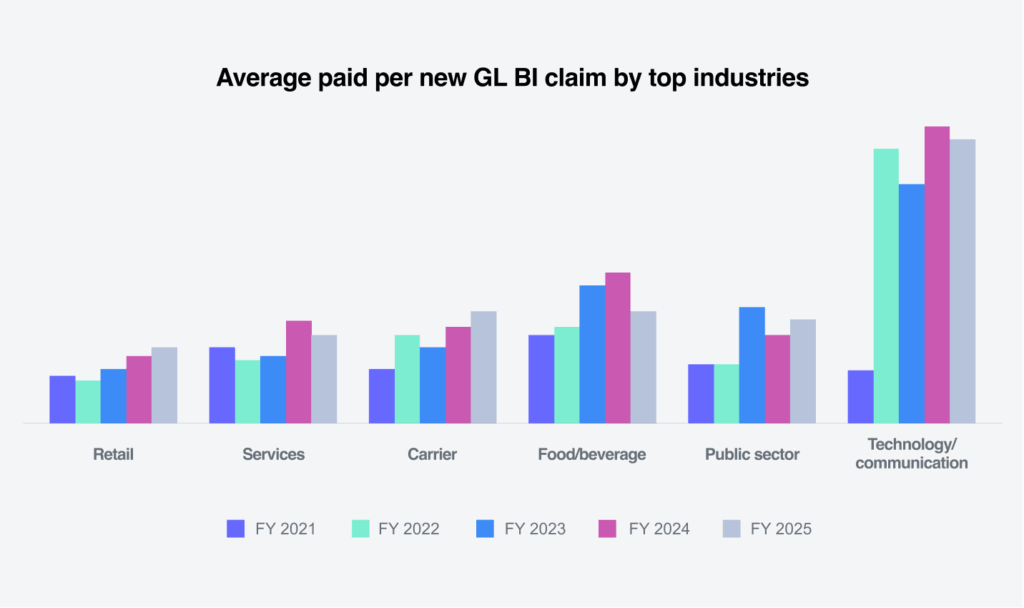
The average paid per new GL bodily injury claim increased in the retail (+10%), carrier (+21%) and the public sector (+25%) categories. While the technology/communications sector saw a decrease of 5%, it still had highest average paid for GL bodily injury.
California experienced the largest increase in average paid for new GL bodily injury claims at 14%, with New York (+5%) and Texas (+4%) also seeing increases. Texas had the highest average paid per new GL bodily injury claim. Florida experienced the largest decrease at 23%, driven by the 2023 tort reforms. Overall, the AAPC for all states has been 10.1% since FY 2021.

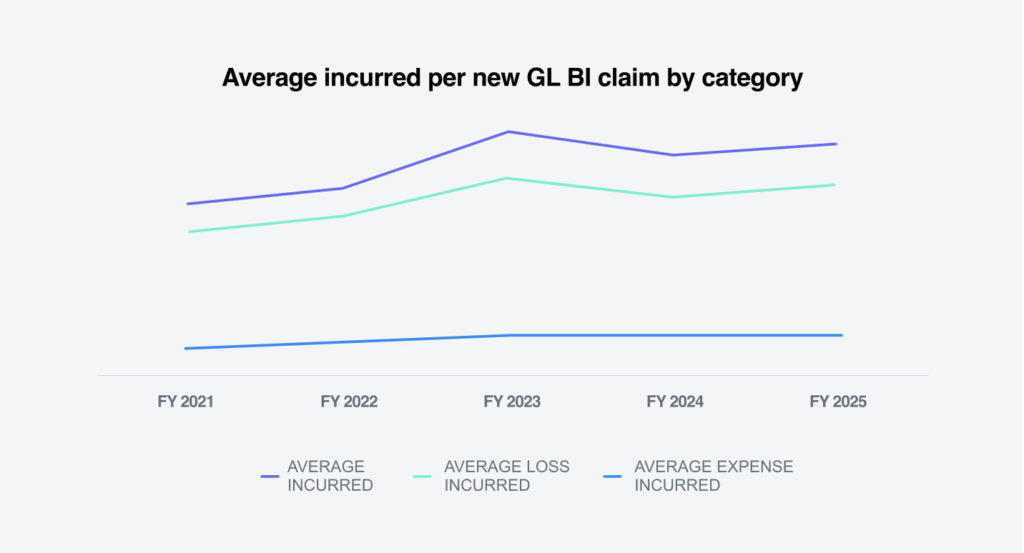
The average incurred loss for all new GL claims decreased 0.8% in FY 2025 compared to FY 2024. The decrease occurred in both average loss incurred as well as average expense incurred.

The average incurred for new GL bodily injury claims increased 1.3% compared to FY 2024, after having decreased for the first time in FY 2024. The AAPC for incurred new GL bodily injury claims has been 7.1% since FY 2021.
The $100,000+ tier for GL claims decreased to 20.6% of the total incurred, representing 0.2% of the new claim volume. The $25,000-$100,000 tier increased to 34% of the total incurred, representing 2% of the new claim volume.
Litigation
>
50%
GL litigated claims come in the door with attorney representation
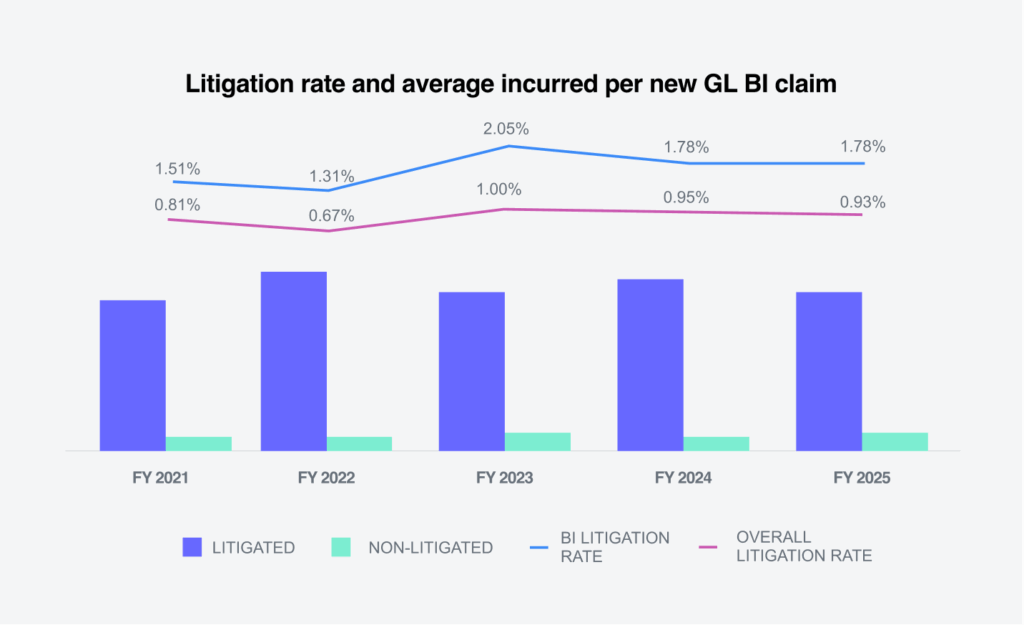
The litigation rate for new GL claims decreased slightly to 0.9%, representing a 0.02% decline from FY 2024 and the second consecutive year of decreased litigation for new GL claims. Despite the overall decrease, the data shows a continuing trend of more aggressive attorney representation rates, with a 5% increase in the number of new GL litigated claims being represented by an attorney before the claim was opened. This was the first time in the last five years that more than half of all new GL litigated claims came in the door with attorneys already involved.
The litigation rate for new GL bodily injury claims remained flat at 1.8%, even as the overall litigation rate declined.
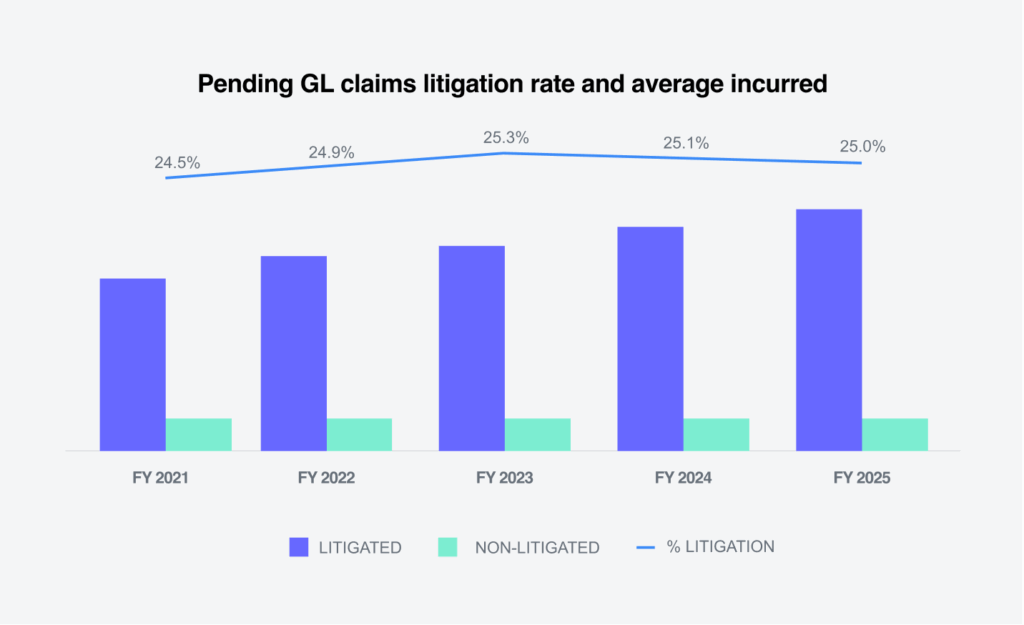
The litigation rate of pending GL claims decreased to 25%. The average incurred for pending litigated GL claims increased 8.4%, the most in the last five years. The AAPC over the last five years for litigated claims has been 8.9%, while the same measure for non-litigated claims has been 1.9%.
New York’s new GL litigated claims rate was 2.7 times the national average at 2.5%. California (1.2%) and Florida (1.1%) also had new GL litigated claims rates that exceeded the national average.

Litigated aged pending claims of two or more years decreased 0.1% to 20.7% from FY 2024.

GL aged pending was seen primarily in New York, which had the highest percentage at 42.4%. California (30.9%) and New Jersey (24%) were both above the nationwide average of 20.7%.

Closures
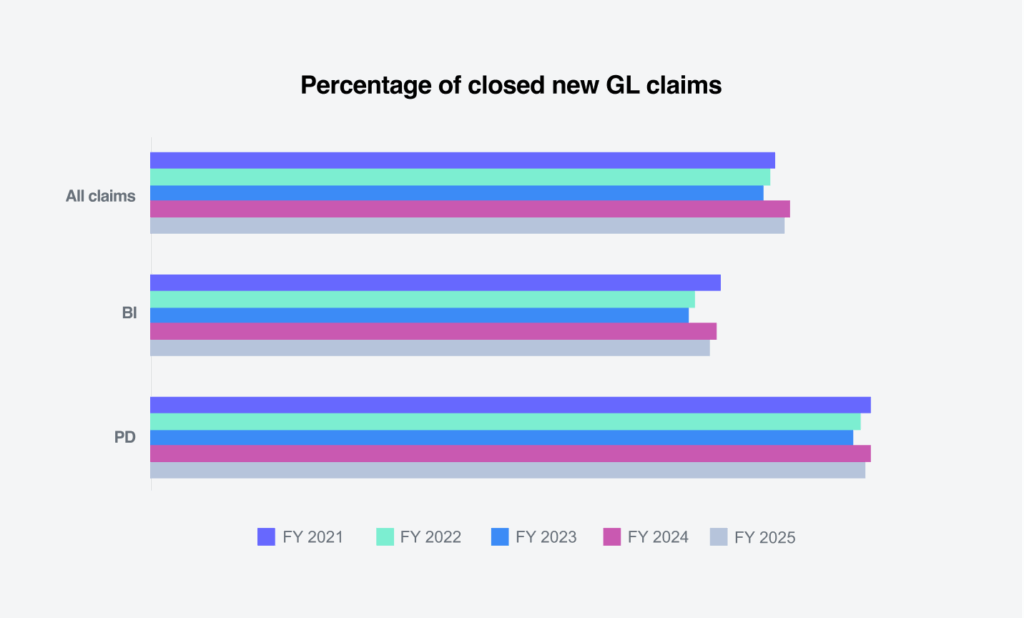
Closure rates for new claims were relatively flat
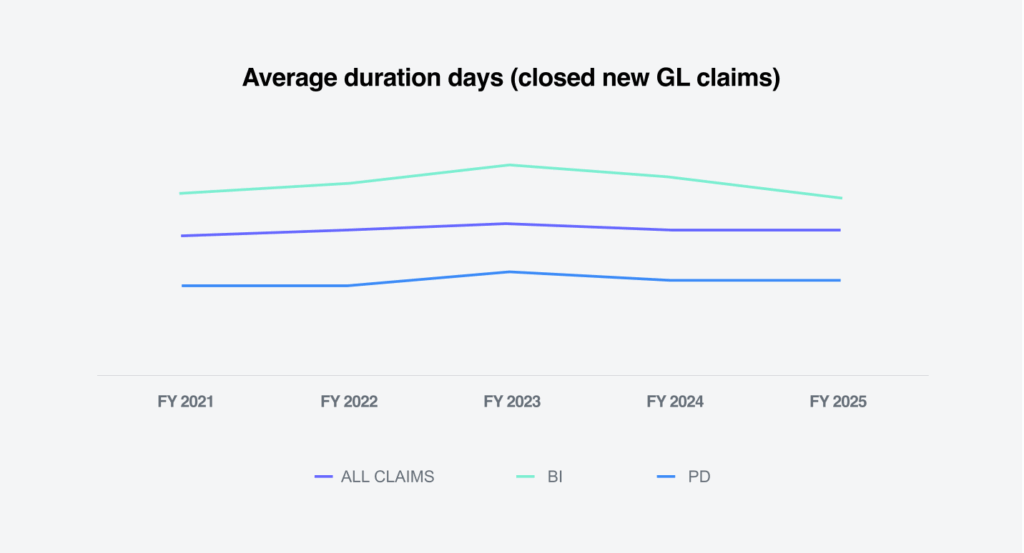
Overall liability closure rates for new claims in FY 2025 were relatively flat in comparison to FY 2024. Bodily injury closure rates decreased slightly, while property damage closure rates remained flat.
The average duration of all new GL claims decreased by two days. This was driven by bodily injury claims, which decreased by four days.
Litigated closed GL claims increased to 5.9% of all closed claims and accounted for 66% of the total dollars paid on closed GL claims. The average paid for a litigated claim increased 11.3% in FY 2025, while the average paid on non-litigated closed GL claims increased 2.9%.
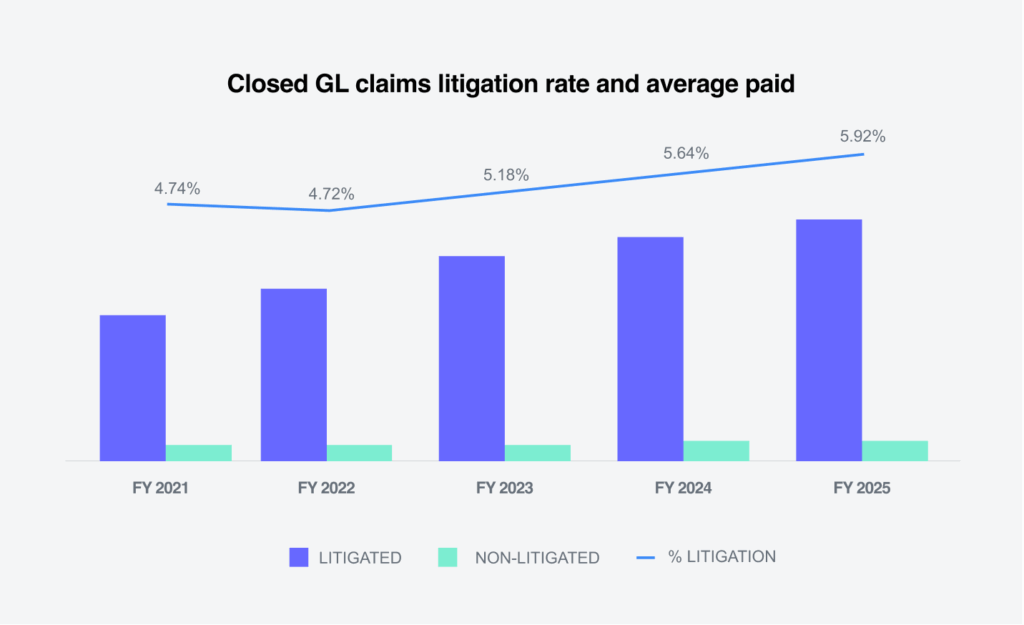
The higher-tier incurred groups have seen increases in overall closed GL claim volume for five years, with the largest tier of $100,000+ accounting for 2.2% of all closed GL claims. However, when comparing the overall GL closed claim incurred stratifications, that same tier accounts for 76% of the total incurred.
When focusing on closed GL litigated claim volume, the percentage of highest severity claims now represents 29% of the closed litigated claim volume. This is an increase of 3% from FY 2024 and 11% above FY 2021. More claims are closing at the higher-incurred stratifications.
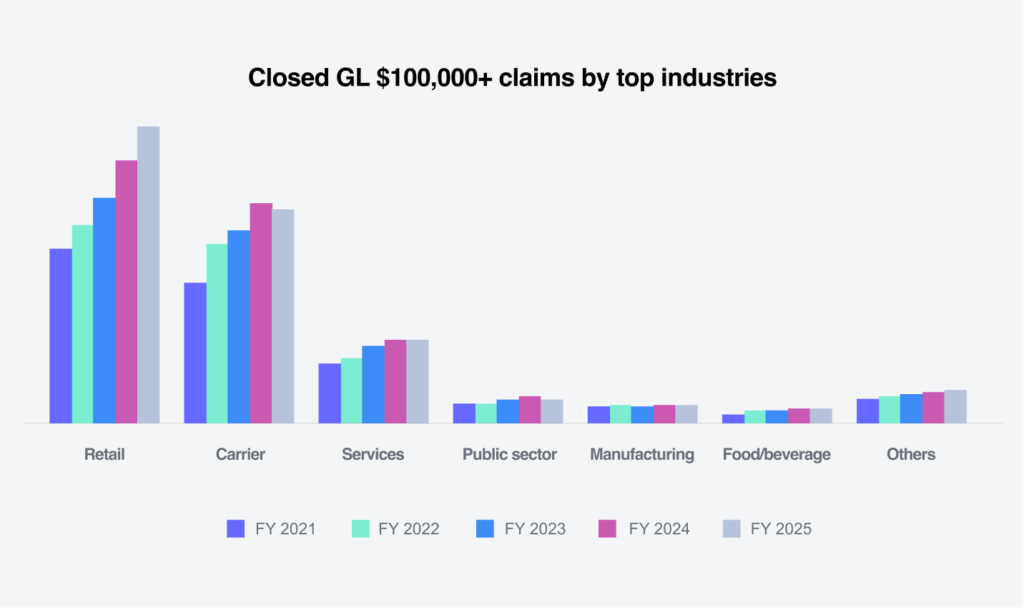
Increases in the number of closed GL claims coming from the $100,000+ tier are affecting all industries, though the retail sector saw the greatest growth, at 22.4% over FY 2024. The second largest increase was from the food/beverage industry at 6%.
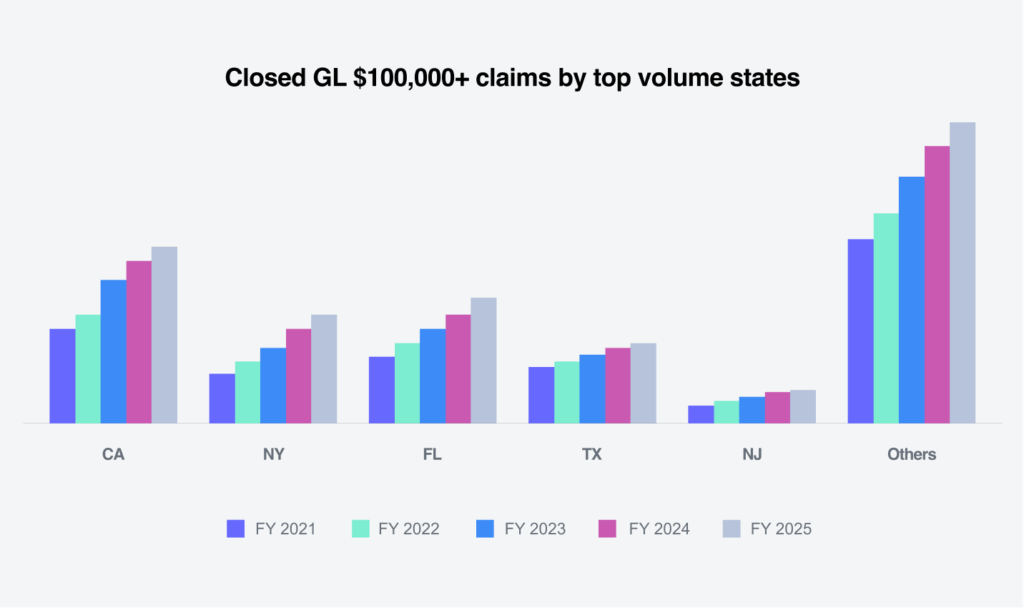
Florida (+16%) experienced the largest increase in closed GL claims over $100,000, while Texas and California both experienced 11% increases. The AAPC over the last five years shows Texas with the largest annual increase at 27%, followed by Florida (+26%) and California (+24%).
Future considerations
Litigated
Non-Litigated
Sedgwick trends
In FY 2025, Sedgwick’s general liability data reveals a complex but encouraging picture of operational performance amid rising litigation costs and evolving claim dynamics. Claim durations shortened by two days overall, with bodily injury claims decreasing by four days. Aged pending claims over two years dropped to 20.7%, marking a five-year low and indicating successful efforts to reduce backlog and accelerate resolution timelines.
Despite a slight decline in the overall litigation rate to 0.9%, the severity of litigated claims continued to climb. The average incurred for pending litigated claims rose 8.4%, which is the highest in five years. Closed litigated claims now represent 5.9% of total volume and account for 66% of total paid dollars. This widening cost gap underscores the need for targeted litigation strategies and smarter defense investments.
Attorney representation trends also shifted significantly. For the first time, more than half of new GL litigated claims were represented by attorneys before the claim was even opened, which represents a 5% increase over FY 2024.
High-severity claims, particularly those exceeding $100,000, continue to rise in both frequency and financial impact. These claims now account for 76% of total incurred dollars on closed claims. The retail and food/beverage sectors experienced the largest year-over-year increases in high-severity claim volume, at 22.4% and 6%, respectively.
In response to these challenges, Sedgwick is investing in AI-driven analytics, jurisdictional benchmarking and litigation support tools to help clients proactively manage risk and cost.
These innovations are being used to identify early indicators of litigation, optimize defense spending and support more informed settlement strategies, positioning Sedgwick as a strategic partner in navigating the increasingly complex general liability landscape. Our recent acquisition of a legal spend management business, now named Bill ReviewIQ, is already providing insights into litigation expenses and is poised to inform and enable new litigation strategies in the future.
Industry concerns
The GL landscape continues to be shaped by a combination of persistent and emerging challenges that are negatively impacting claim outcomes and increasing costs in nearly every corner of the industry.
Social inflation and nuclear verdicts
Social inflation continues to rise at levels much faster than general inflation — driven by juror sentiment, an anti-corporate bias and changing societal expectations about who should be responsible for injuries. The plaintiffs’ bar is outpacing the defense industry in leveraging psychological tactics to influence outcomes. They have also successfully leveraged AI to guide case strategy and improve outcomes.
Tort reform
Tort reform activity took the stage in early 2025 with Georgia passing two significant tort reform bills aimed at reducing lawsuit abuse and restoring fairness to the courtroom. Louisiana also passed some needed reforms including switching their tort system to modified comparative, away from pure comparative. Oklahoma successfully passed a bill to reinstate a cap on non-economic damages.
For as many steps forward as tort reform took, there were equal steps made toward broadening tort actions and introducing novel theories of liability. Opponents of tort reform are actively working to deteriorate recently passed reforms with new bills. Businesses providing products and services in areas where these bills are being introduced should familiarize themselves with the proposed laws.
There were opportunities to pass additional tort reforms that were not capitalized on — most notably in Texas, which failed to pass two bills that advocates believe would have benefited their legal environment.
It’s now been two years since Florida’s tort reform package, HB 837, was signed into law, and the legal climate there is starting to show signs of recovery. More time will be needed before we can fully evaluate the utility of the changes.
Cultural values
Shifting cultural values and the influence the plaintiffs’ bar can exert are areas the insurance industry must understand. There is a rising trend of anti-corporate sentiment that is particularly salient when it comes to companies involved in the insurance industry. A recent survey by Emerson College of voters aged 18-29 found that 41% believed the actions of the alleged killer of the CEO of UnitedHealthcare were somewhat or completely acceptable. The defense bar must find a way to portray corporate clients in such a way that juries can identify with them.
Attorney representation
Attorney representation behavior is changing the speed in which injured parties become represented. Of the nearly 1.3 million lawyers in the U.S., over 135,000 (roughly 10% of all practicing attorneys) are personal injury lawyers. The American Tort Reform Association has published data suggesting that personal injury attorneys have spent $2.5 billion in attempts to solicit legal claims across the U.S. in 2024 alone. By comparison, only $1.1 billion was spent advertising pizza restaurants during that same time frame.
Talent crisis
A talent crisis is looming in both the insurance defense and claims adjuster professions. Forbes reports an estimated 400,000 employees are expected to retire from the insurance industry by 2026. As these older professionals depart the workforce they aren’t being replaced quickly enough. This so-called “retirement cliff’ represents a significant loss of institutional knowledge if insurers are not able to augment this with other solutions such as AI.
A recent survey conducted for the 2024 CLM Defense Counsel study found that 90% of respondents say it is much more difficult to attract and retain talent. Higher caseloads and the friction points with carriers and their billing and litigation guidelines were cited as the two most challenging issues. This survey also cites a perception of diminishing expertise level on the part of claims professionals that leaves defense counsel driving more case strategy on their own with less collaboration.
Conclusions
The 2025 general liability landscape presents a mix of progress and pressure.
While operational metrics such as claim duration and closure rates have improved, the financial and strategic burden of litigation continues to increase. The average incurred cost of litigated claims has reached a five-year high, and high-severity claims now dominate the financial footprint of closed claims. These trends underscore the growing influence of social inflation, evolving jury expectations and increasingly sophisticated plaintiff strategies.
Attorney involvement is accelerating, with more than half of new litigated claims now represented before they are even opened. This early engagement, coupled with rising litigation costs and a surge in high-dollar claims, demands a more proactive and data-driven approach to defense. Sedgwick’s investments in AI-powered analytics, litigation support tools and jurisdictional benchmarking are critical to helping clients navigate this environment with greater precision and foresight.
At the same time, the industry faces structural challenges. A looming talent crisis threatens to erode institutional knowledge, while tort reform efforts remain uneven across the U.S. Cultural shifts, including growing anti-corporate sentiment and the influence of aggressive legal advertising, are reshaping the litigation landscape in ways that require both strategic adaptation and legislative vigilance.
To succeed in this environment, stakeholders must balance legal cost discipline with targeted investments in defense, technology and talent. The path forward lies in early identification of the most severe claims and moving them into unique workflows designed to influence outcomes that are not only efficient but equitable. Sedgwick remains committed to leading this charge by empowering clients with the insights, tools and strategies needed to thrive in an increasingly complex liability ecosystem.