
2025 MID-YEAR
Workers’ compensation

Report Objectives
This report aims to summarize the present metrics for our workers’ compensation (WC) programs, assess the landscape of WC claims and litigation and benchmark our patterns against comparable industry research. To aid our analysis, we utilized research from the following entities:
- National Council on Compensation Insurers (NCCI)
- California Workers’ Compensation Insurance Rating Bureau (WCIRB)
- Workers’ Compensation Research Institute (WCRI)
data parameters
Key observations
Though workers’ compensation claim volume dropped slightly in FY 2025, costs continued to climb, particularly for indemnity claims and older age groups. Litigation rates increased and so did average incurred costs for both litigated and non-litigated indemnity claims.
1%
.5%
4.1%
1.1%
14%
Download a summary slide with these key observations.
REPORT CONTENTS
REPORT CONTENTS
Market
MOST PROFITABLE SEGMENT
According to the NCCI State of the Line Report released on May 13, 2025, during its Annual Insights Symposium (AIS), workers’ compensation remains the most profitable segment of the commercial property and casualty insurance (P&C) lines.
Key insights from this report, compiled from insurer results for the 37 states in which NCCI recommends workers’ compensation rates, include:
- Workers’ compensation continues to have the largest underwriting profitability of all the P&C lines shown, with a calendar year net combined ratio of 86% and a 24-point operating gain in 2024 — a 14% underwriting gain combined with a 10% investment gain.
- Workers’ compensation’s 2024 accident year combined ratio is 99%, with prior years continuing to experience downward reserve development.
- Severity grew in 2024, with increases of 6% for medical claim severity and 6% for indemnity claim severity.
Despite the workers’ compensation system’s continued strong results, the data presents several issues the market must navigate:
- Lost-time claim frequency for accident year 2024 is expected to be 5% lower than for accident year 2023 — making it the third consecutive year that the decrease in frequency was greater than the long-term average decline.
- Net written premium for the workers’ compensation insurance market decreased 3.2% in 2024 —the only premium decrease of the P&C lines — driven by decreases in rates across 31 states that exceeded the pace of payroll growth.
- According to the National Association of Insurance Commissioners’ annual Market Share Report for the P&C insurance marketplace, the total direct premiums written in the workers’ compensation market fell by approximately 1.4% in 2024 compared to 2023.
- The workers’ compensation premium share of the P&C commercial lines sector has decreased from nearly 17% in 2004 to 10%.
California makes up more than 20% of the national workers’ compensation market, and on July 24, 2025, the WCIRB released its 2025 State of the System. Among the key metrics highlighted in this report are:
- The California preliminary calendar year combined in 2024 ratio is 109, which is higher than countrywide for the fourth consecutive year. The projected accident year combined ratio for 2024 is 127%, the highest in over 20 years.
- An average advisory pure premium rate of 8.7%, effective Sept. 1, 2025, was approved by the California Department of Insurance (DOI) for the first time in a decade, although the average charged rate continues to be at historical lows.
- Lost-time claims frequency is increasing in California, driven by an increasing share of claims involving cumulative trauma.
- Average medical costs increased by 8% in 2024, a rate not seen since before the enactment of Senate Bill 863. This is driven by an 11% increase in the overall average cost of medical services per claim and greater medical utilization across multiple service categories.
- Average allocated loss adjustment expense costs rose sharply in 2022 through 2024, driven in part by increased litigation across the state — much of it originating from law firms based in the Los Angeles area.
Claim volume
1%
Decrease in total claim counts
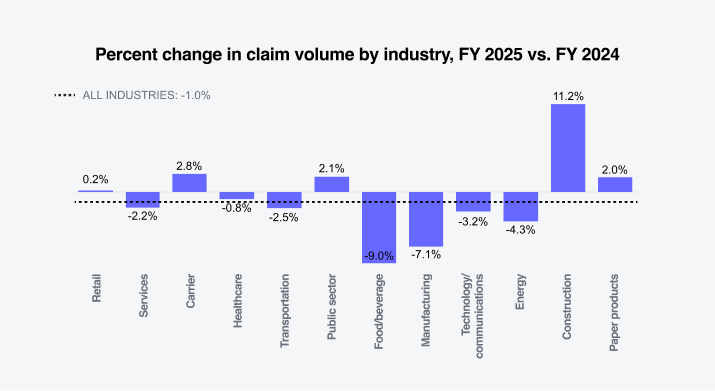
The decrease in total claim counts during FY 2025 is not unexpected, given the declines in claim frequency. According to the U.S. Bureau of Labor Statistics (BLS), the number of annual workplace injuries decreased from 2.95 million in 2014 to 2.57 million injuries in 2023, with 1.4 million fewer injured workers over a 10-year period. Additionally, the U.S. labor market showed signs of slowing growth, with job creation significantly lower than in previous years.
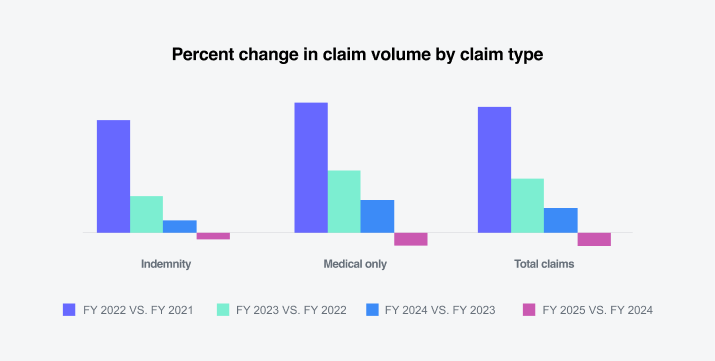
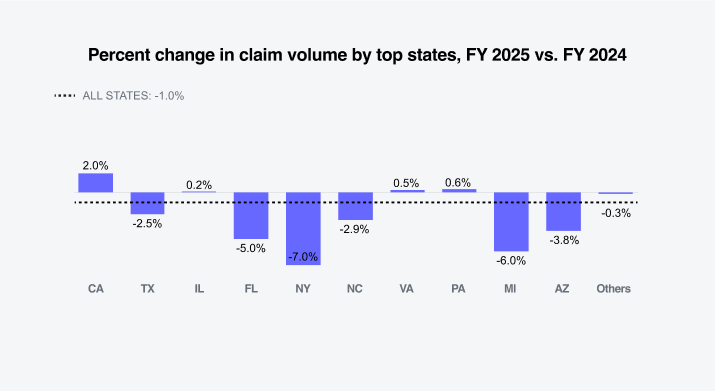
Sedgwick’s data reflects that the largest percentage change increases in claim volume occurred in California, Illinois, Virginia and Pennsylvania. The largest percentage change decreases in claim volume occurred in Florida, New York and Michigan.
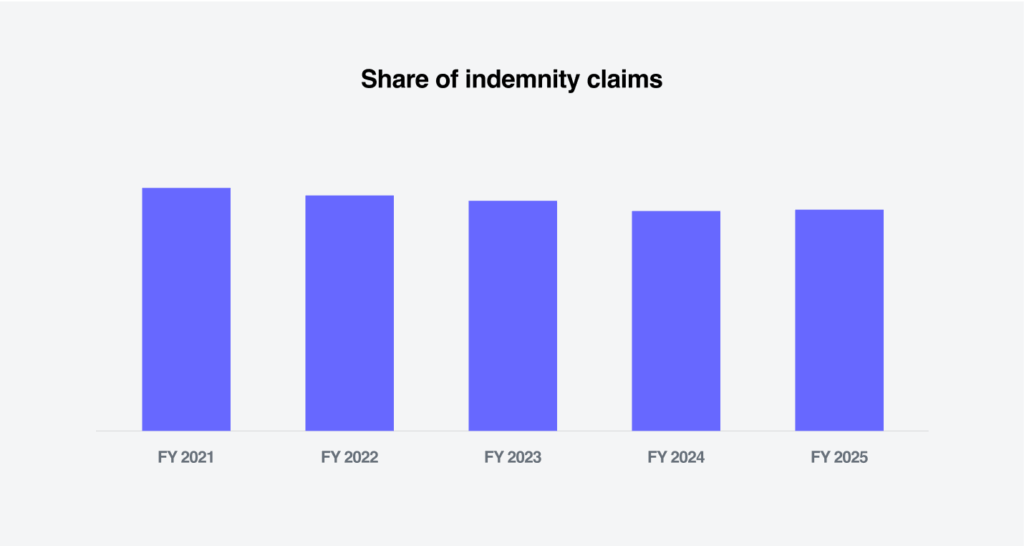
The share of indemnity claims versus medical-only claims held steady in FY 2025.
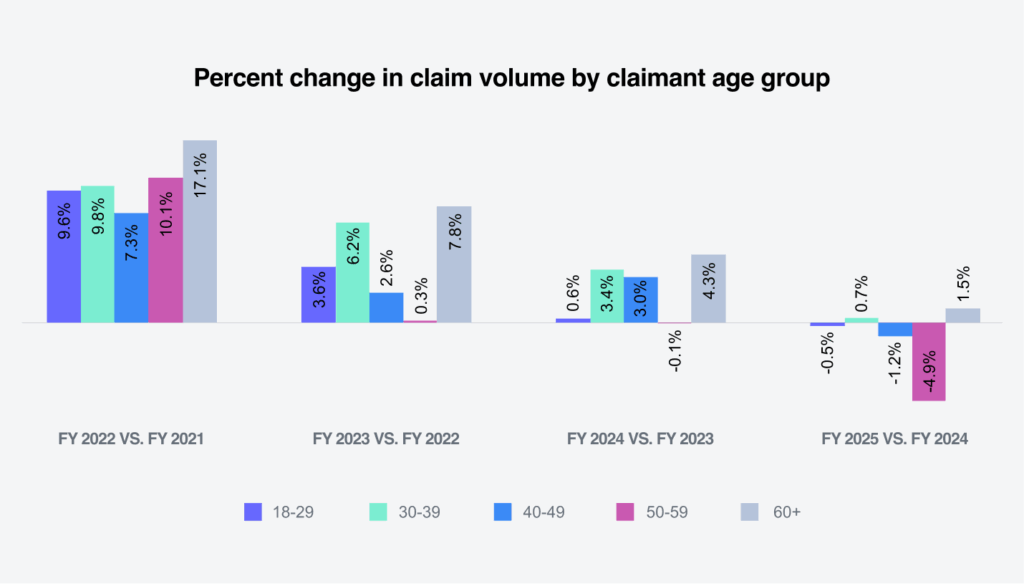
Demographics continue to play a major role in workers’ compensation. According to the BLS Employment Projections, from 2023 to 2033, employment is expected to increase by 13% for workers aged 65 to 74 and by 21.7% for workers 75-plus. Sedgwick’s breakdown of indemnity claims by claimant age group reflects that the 18 to 29 age group has the lowest indemnity rate of 15%, and the 60-plus age group has the highest indemnity rate of 28.3%.

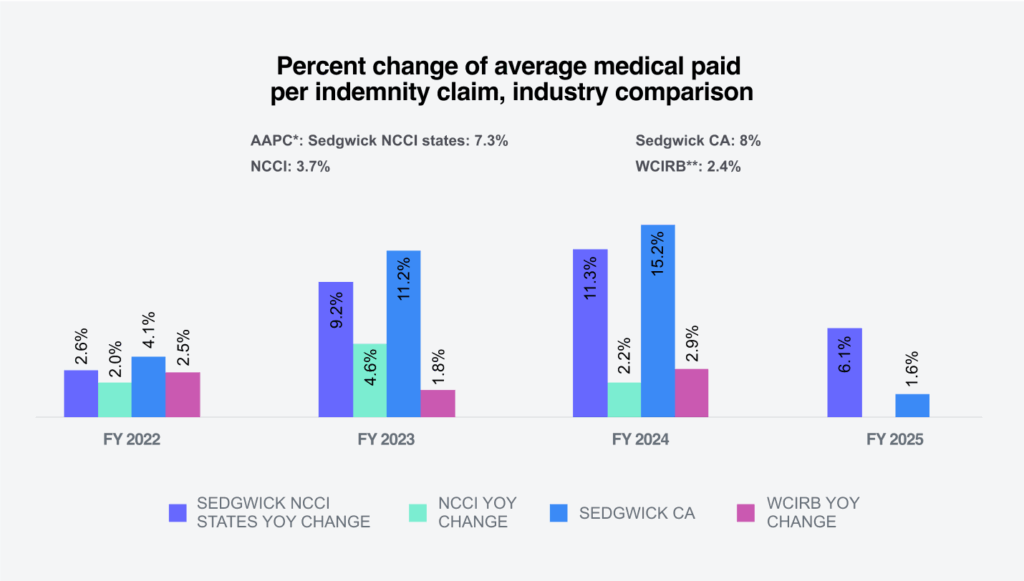
The following shows Sedgwick’s percentage change in indemnity claims compared to industry group experts.
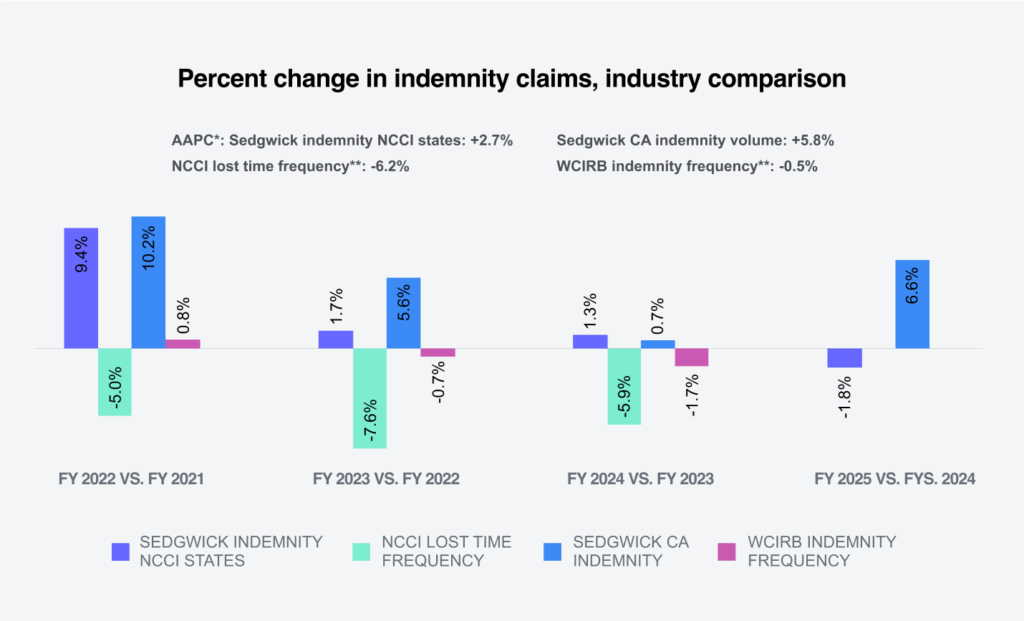
* Annual average percentage change.
** NCCI and WCIRB normalize data with employee counts or payroll.
Indemnity costs
4.1%
Increase in average paid
There was a 4.1% increase in the average paid per indemnity claim in FY 2025 compared to FY 2024.
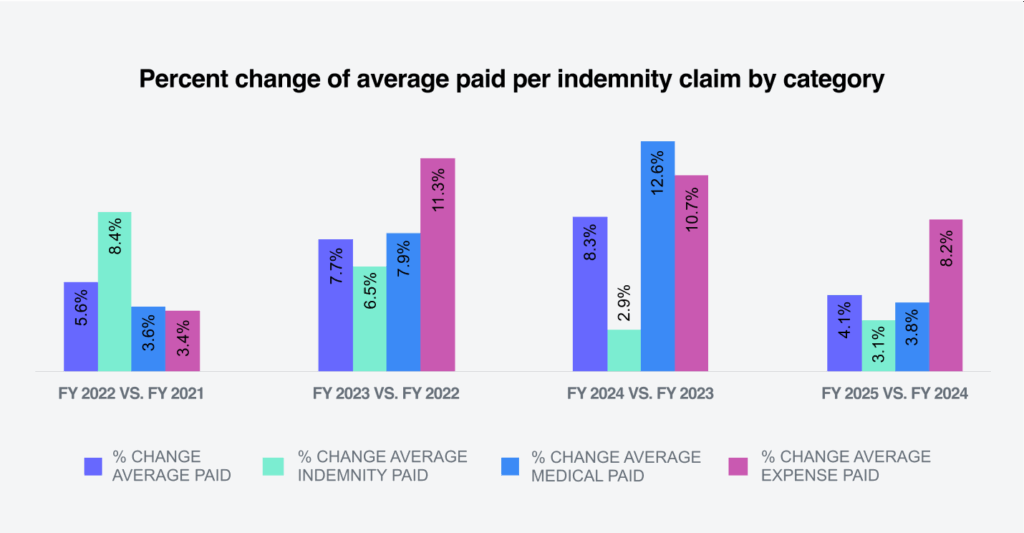
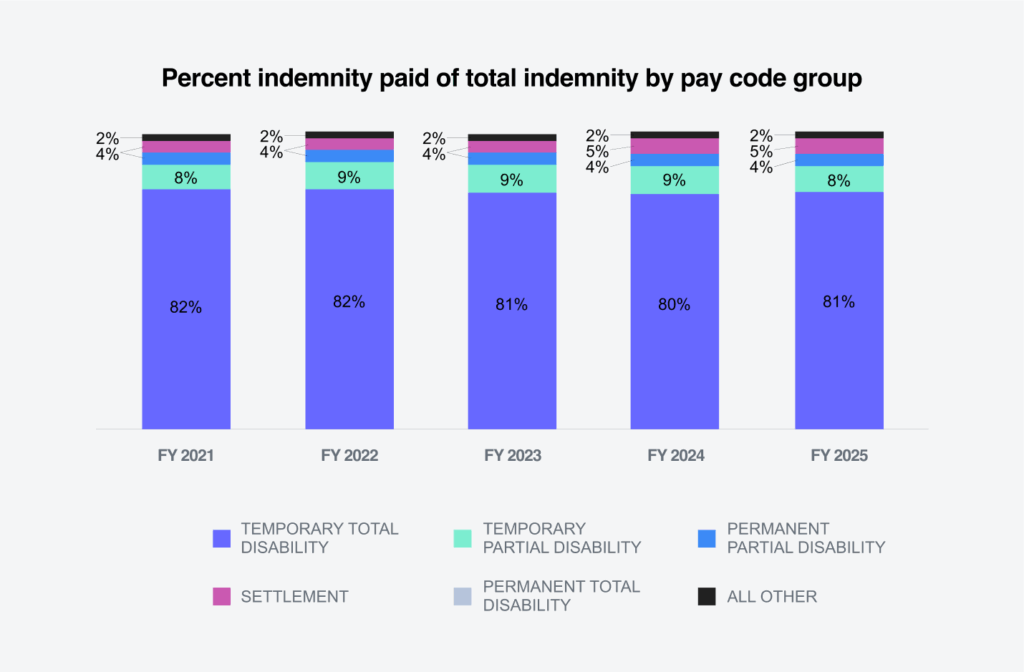
Indemnity benefit payments, which are calculated based on wages earned, increased 3.1% per indemnity claim in FY 2025. Temporary total disability represents 81% of all indemnity benefits paid.
The state filter in the average weekly wage (AWW) inflation tool allows for comparisons of the AWW by state. According to the BLS Employment Cost Index issued July 31, 2025, wages and salaries increased 4.6% for union workers and 3.5% for non-union workers for the 12-month period ending in June 2025. In 2025, 21 states will have minimum wage increases, according to the The Economic Policy Institute’s tracker.
It’s noteworthy that most states annually index their maximum indemnity benefit to the state average weekly wage (SAWW) to prevent inflation from eroding the level of workers’ benefits. Accordingly, indemnity benefit costs will vary by jurisdiction.
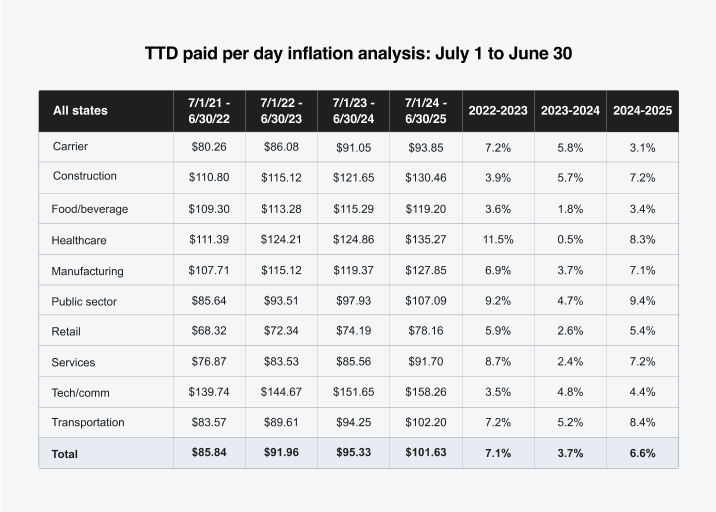
Our inflation analysis of total temporary disability (TTD) paid per day indicated a 6.6% increase for FY 2025 compared to FY 2024. The public sector and transportation and healthcare industries experienced the largest increases at 9.4%, 8.4% and 8.3%, respectively.
Twenty-three states had TTD paid per day inflation of 7% or higher, with some of the larger-volume states being California (9%), Florida (9%), Texas (8%), Georgia (7%), Illinois (7%) and New York (7%).
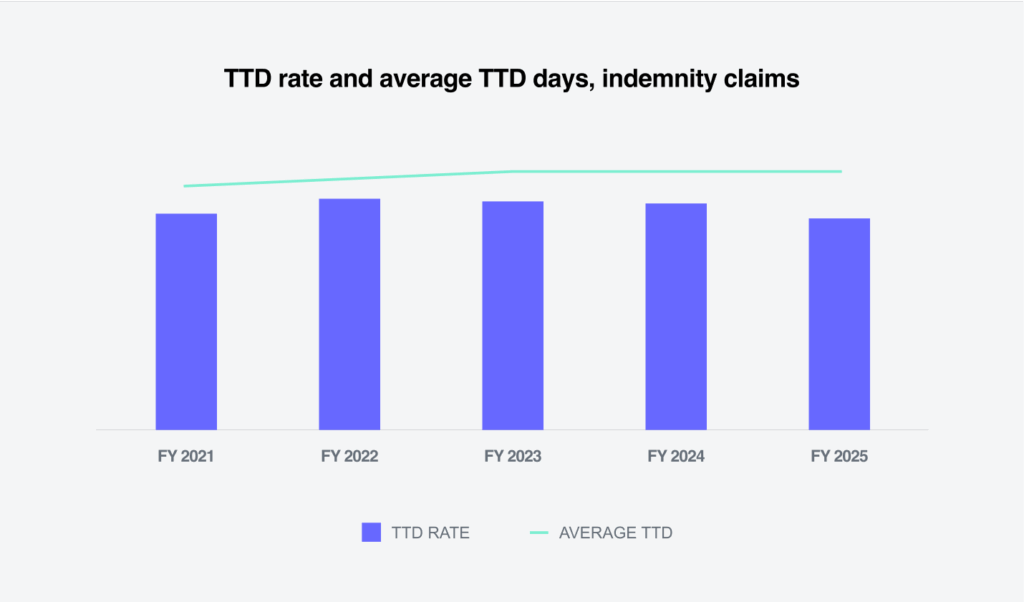
The rate of indemnity claims with at least one day of TTD payments remained consistent in FY 2025. There was a slight decrease in TTD rate for all age groups. This is another indication that indemnity costs are being driven by wage increases, given the consistency of the TTD days and decreasing rate.
Sedgwick’s year over year changes for FY 2025’s average indemnity paid per indemnity claim were greater for NCCI states, but less for California.
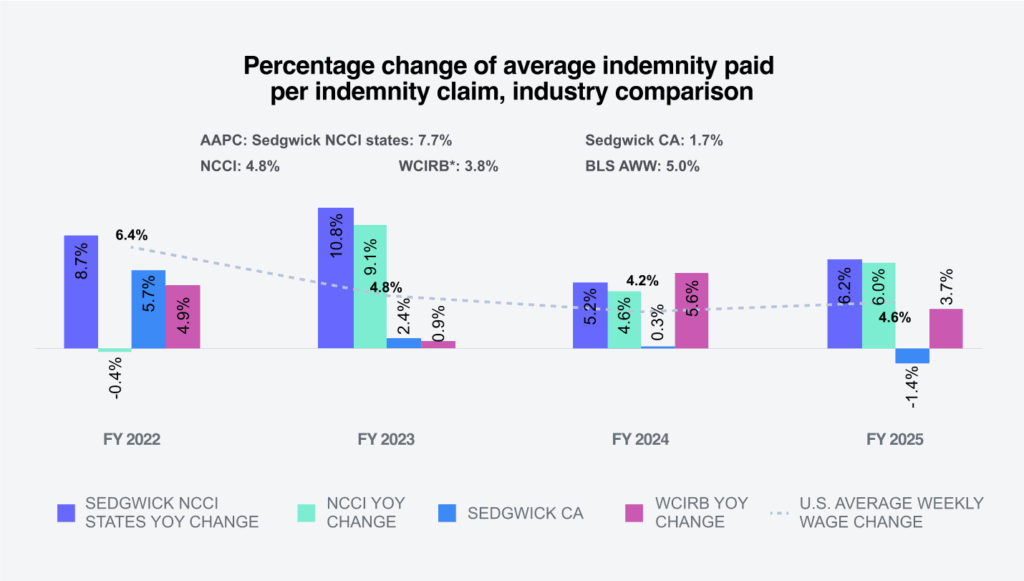
* WCIRB reports ultimate indemnity severity
Medical costs
6%
Increase in average paid
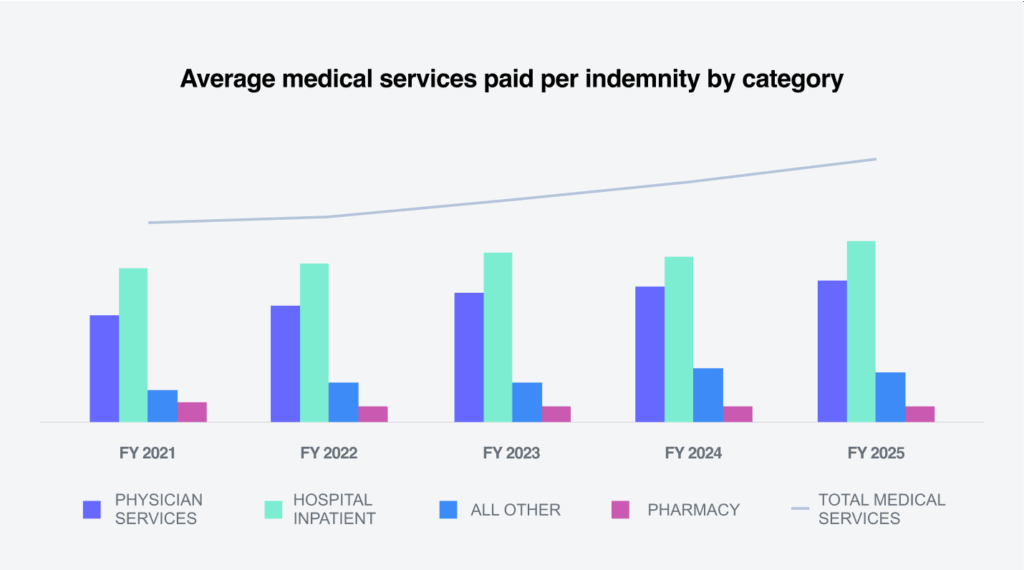
Average medical services paid per claim increased 6% from FY 2024 to FY 2025 across all categories of medical services. Physician services, which comprise almost 60% of Sedgwick’s medical spend per indemnity claim, increased 6.8% from 2024 to 2025. Spending on facilities, which includes hospital outpatient, ambulatory surgical center and hospital inpatient, continues to be a significant workers’ compensation cost driver and increased 5.6%.
Two factors drive changes in medical claim costs: the price of medical services and utilization, which measures the mix and number of services provided to an injured worker.
Price for medical services
Sedgwick’s medical inflation analysis tool indicates a 3.4% increase in the price per service between FY 2024 and FY 2025 in all states for the following service groups: evaluation and management, physical therapy, major and minor diagnostics and surgeries. The NCCI Medical Inflation Insights report, issued July 23, 2025, indicates a 2.5% workers’ compensation weighted medical price index (WCWMI) over the one-year period ending June 30, 2025.

Drilling deeper, our tool reveals that the cost for surgeries in FY 2025 increased 7.9% from FY 2024. In addition to filtering data by service group, this tool allows inflation analysis by:
- State
- State groups (fee schedule and non-fee schedule)
The increase in the price per service was only 2.9% for fee schedule states and 6.7% greater for states without a fee schedule for professional medical services (i.e., Indiana, Missouri, New Jersey and Wisconsin).
Impact of state fee schedules
Workers’ compensation medical reimbursement is highly regulated by state. Currently, 44 states and the District of Columbia have physician/professional services fee schedules. Out of those 45 fee schedule jurisdictions, 35 have had updates over the past year.
There are substantial differences in the fee schedule approaches adopted by the states, but the majority of these fee schedules implemented are based on Medicare’s relative values scale. The WCIRB 2025 State of the System report indicates that a major driver of medical costs growth in California has been the updates to medical fee schedules tied to Medicare values.
- Connecticut House Bill 5695 repeals the statutory requirement that the conversion to the Medicare resource-based relative value scale (RBRVS) as the basis for practitioner fees under workers’ compensation be revenue-neutral. Although the fee schedule maintains a measure of cost control by continuing to limit annual growth in total medical fees to the Consumer Price Index for urban workers (CPI-U), an increase in medical costs is anticipated as of the fee schedule revision on July 15, 2025.
- Delaware Senate Bill 164 provides a one-time increase of 3% in aggregate workers’ compensation medical expenses to correct evaluation and management (E&M) code reimbursements, which have fallen below the Centers for Medicare & Medicaid Services rates.
Medical severity by age group
Not surprisingly, the average medical services paid per indemnity is greater as employees age. For the 60-plus age group, the average medical services paid was over 27% greater than for the overall average medical services paid per indemnity claim.
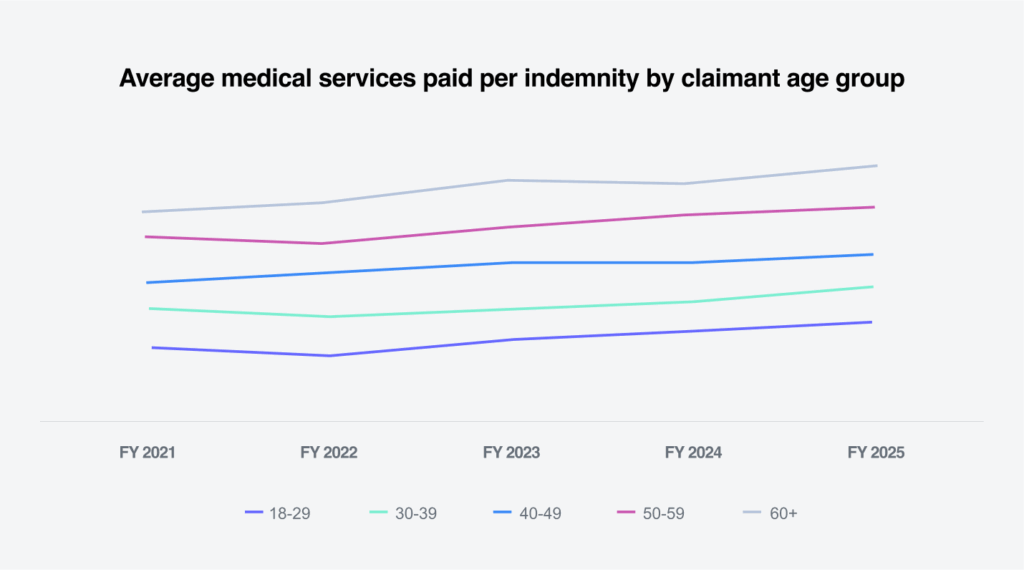
As people age, preexisting conditions and comorbidities often complicate and prolong medical treatment, ultimately increasing costs. According to the Centers for Disease Control and Prevention’s (CDC) National Institute for Occupational Safety and Health (NIOSH), older workers are less likely to be injured, but their injuries are more likely to be serious or fatal, particularly after age 60.
Sedgwick’s bill review services maximize savings through proprietary rules that identify bill coding inaccuracies, as well as utilization of provider network and out-of-network repricing solutions.
Utilization
In addition to the cost factors outlined above, utilization is the other major determinant of medical costs. According to the 2025 NCCI State of the Line, physician utilization experienced a 4% increase in a variety of categories including physical medicine, surgery (major and minor) and evaluation and management. The WCIRB 2025 State of the System highlights a rise in utilization across multiple service categories that began in 2024.
Multiple states have adopted varying jurisdictional policies and guidelines to ensure timely and medically necessary care for injured workers that affects utilization of services.
At Sedgwick, we leverage AI-driven clinical insights from scanning medical bills, notes and documentation to flag claims that may benefit from early clinical support — enabling faster referrals to our clinical teams to ensure delivery of timely, high-quality care while reducing claim severity. Automated and electronic referral options are integrated into our proprietary claims management system and allow our claims examiners and nurses to quickly exchange information and provide prompt responses to the treating providers and injured employees.
Sedgwick’s average medical services paid per indemnity claim for FY 2025 cannot yet be compared with the industry. However, in 2024, our average medical paid per indemnity claim showed increases that are just now being reflected in industry reports due to lags in the data used for analysis.
* Medical paid includes all pay codes
** WCIRB reports ultimate medical severity
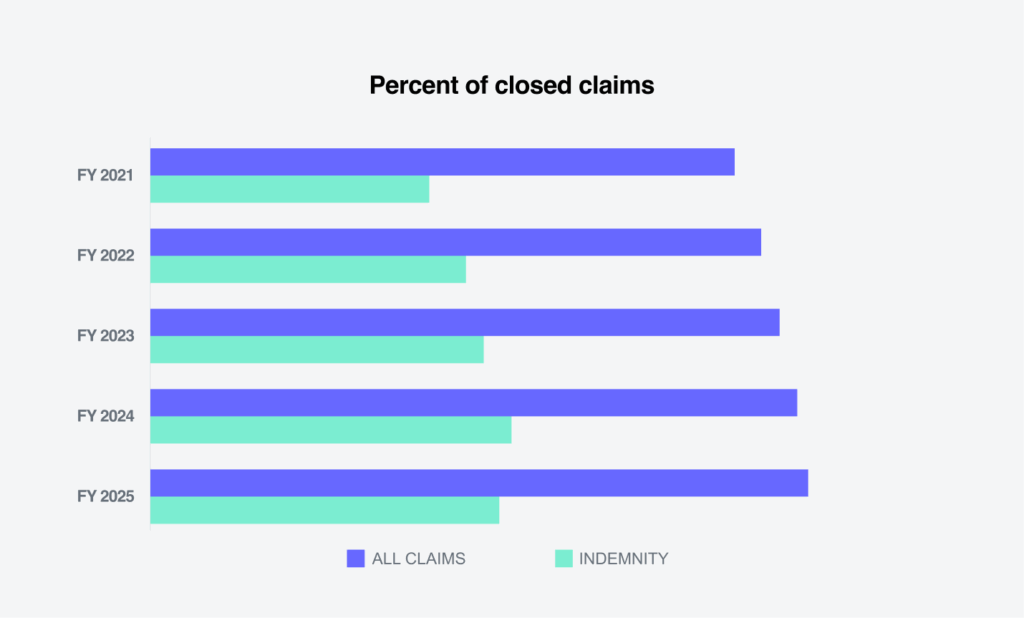
Closures
Closure rates for indemnity claims were basically flat
The percentage of all claims closed in FY 2025 showed a slight improvement, with indemnity claims remaining basically flat.
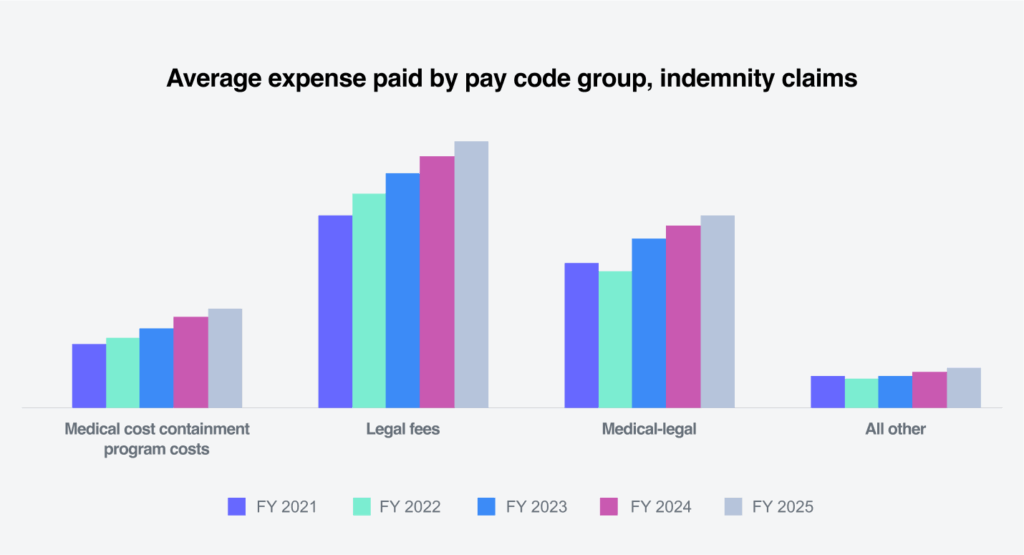
Expense costs
Average allocated loss adjustment expense costs per indemnity claim are driven by three major categories:
01
Average medical cost containment program costs
02
Legal fees
03
Medical-legal
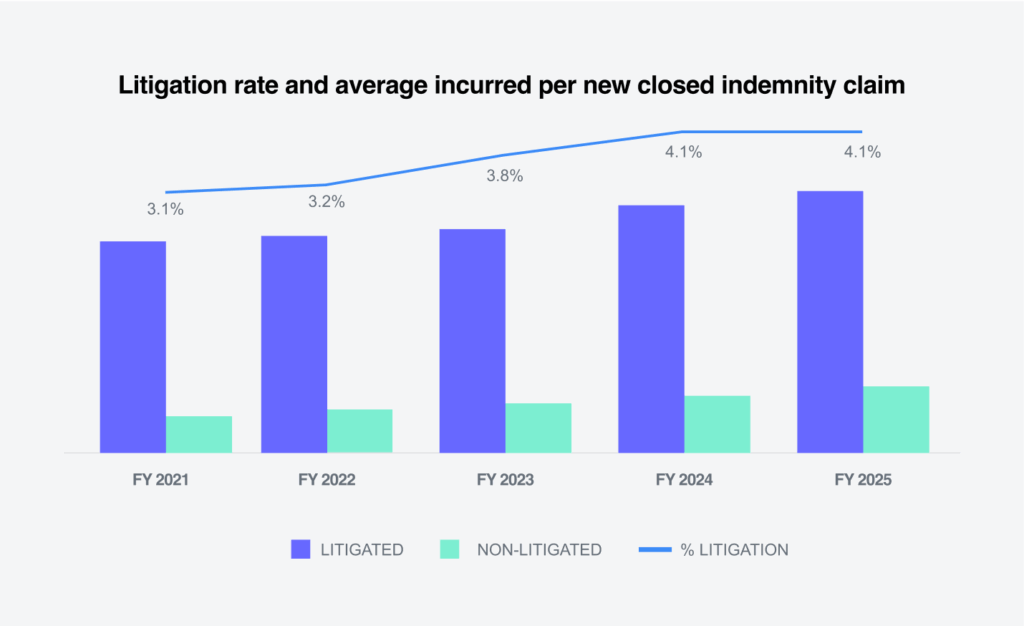
Average expenses paid increased in each of these categories. Legal fees showed the largest increase of 5.8%, followed by medical cost containment at 4.9% and medical-legal fees at 4.5%. The percentage increase of each was less than FY 2024.
Defense attorney fees made up 81.6% of legal fees and the average paid increased 1.3% in FY 2025. Legal fees increased 5.8% in FY 2025, driven by increases in attorney (non-litigated), court costs, court reporters, deposition, photocopies and non-medical witness fees.

In 2025, closed litigated claims remained flat, representing 4.1% of total closures. Closed litigated claim costs remained over three times more than non-litigated claims (3.83%), which emphasizes the importance of preventing unnecessary litigation.
Our Bill ReviewIQ is another tool that can be used to help control legal costs by identifying and correcting bills non-compliant with established legal billing standards. Additionally, Bill ReviewIQ provides detailed reports and analytics on legal spend, including insights on litigation trends, attorney performance and opportunities for legal expense control. Use of this tool allows claims professionals to focus on strategic priorities like claims management and legal strategy, rather than the audit of legal bills.
Future considerations
The U.S. workplace continues to evolve at an unprecedented pace that is profoundly impacting workers’ compensation.
Employment growth projections and demographic shifts
Shifts in the occupational composition, the age of the workforce and where we work affect injury risks and cost of workers’ compensation claims.
A recent Brookings Institute research report found that the changing occupational composition of the workforce alone will result in a modest increase in overall injury risk for American workers. According to this report, violent injuries are projected to increase by almost 4% across the U.S. workforce, largely driven by job growth among home health workers.
Demographic shifts, such as changes in the age and gender distribution of workers, will continue to impact injury frequency and severity.
The shift to remote work in 2020 led to a decline in claim frequency among office workers, which remains low for those who have continued to work remotely.
As these labor trends evolve, attention to safety, training and return-to-work programs is critical.
Medical costs and accessibility
Medical costs and severity are expected to continue increasing in the future. Several factors are contributing to this trend:
- The National Center for Health Workforce Analysis forecasts a shortage of registered nurses and physicians through 2037. Healthcare workforce shortages impact patient access, claim outcomes and overall healthcare costs.
- Consolidation in hospitals and health systems, along with the acquisition of physician practices, have reportedly led to higher healthcare prices and reduced patient access in rural areas of the country.
- An aging workforce with more underlying chronic conditions contributes to higher medical costs due to the need for more intensive medical care over a longer duration.
- New medical technologies and treatments offer some advantages, such as decreased infection risk and faster recovery times, but often carry greater costs than traditional approaches.
- New tariffs are expected to directly increase the cost of imported durable medical equipment (DME), diagnostic equipment, surgical implants, supplies and pharmaceuticals.
Workers’ compensation is not immune to these trends. Prompt recognition of medical exposures and developing strategies to effectively manage and contain associated costs is more important than ever.
Technology transformation
- Integration of our smart.ly platform with the generative AI capabilities of Sidekick accelerates triage to ensure of claims to ensure every claim is handled with the right level of attention — faster and more accurately than ever.
- Sidekick Agent utilizing optical character recognition (OCR) and generative AI to summarize medical documentation empowers our claim colleagues at the desk level to make smarter and faster decisions.
- Embedding AI-powered voice and chat tools to instantly handle routine inquiries is setting a new standard for claimant communication.
Federal impact on state workers’ compensation
While workers’ compensation laws are governed at the state level, federal policies do influence workers’ compensation claims in areas such as occupational safety, immigration-related employment and independent contractor determinations.
- On May 20, 2025, the U.S. Department of Labor’s Occupational Safety and Health Administration (OSHA) announced an update to its inspection program to prioritize establishments with the highest rates of injuries and illnesses based on data submitted in accordance with OSHA’s record keeping requirements.
- Multiple executive orders related to immigration since January 2025 are expected to result in a decrease of injuries reported by these workers due to fear of deportation. Immigration is controlled by federal law, and under the Immigration Reform and Control Act of 1986 (IRCA), unauthorized immigrants aren’t allowed to work in the U.S. However, whether they can receive workers’ compensation if hurt on the job depends on state law.
- In its Field Assistance Bulletin issued May 1, 2025, the U.S. Department of Labor Wage and Hour Division (WHD) announced that it will use revised guidelines when determining whether someone is an employee or independent contractor under the Fair Labor Standards Act (FLSA). The WHD will now use Fact Sheet #13 (July 2008) and Opinion Letter FLSA2019-6, instead of the 2024 rule.
Heightened regulatory environment
Workers’ compensation is heavily regulated at the state level, as well as at the federal level for programs for federal employees, longshore and harbor workers, etc.
- This year, state legislatures convened in all states, with a few states remaining in session. Legislation this year focused on:
- Expanded presumptions for first responders to either add more conditions (i.e., additional cancer types and post-traumatic stress disorders) or expand eligibility to additional first responders. While presumptions of compensability have historically applied primarily to local, state and federal agencies, Connecticut and New York have recently extended workers’ compensation benefits for PTSD and extraordinary workplace stress to certain private sector employees.
- Several states have also passed bills or issued precedential legal decisions related to increased claimant attorney fees and expanded circumstances when employers may be responsible for the payment of those fees.
- Nevada, Vermont and Washington passed legislation this year to increase penalties for non-compliance with workers’ compensation laws.
- State elections that sometimes affect leadership and enforcement focus within state workers’ compensation agencies are scheduled on Nov. 4, 2025, in New Jersey and Virginia.
We’re closely monitoring these and other trends that may impact the workers’ compensation industry.
Conclusions
Workers’ compensation remains the most profitable segment of the commercial P&C line.
Although the workers’ compensation sector is strong, lost time claim frequency is expected to continue its downward trend, and net written premium will likely remain flat due to decreasing rates in most states across the country.
Overall claims costs increased 4.1%. A primary driver of this increase was inflation. We saw a 6.6% increase in TTD paid per day and a 3.4% increase in the price per service in all states for many service groups. Utilization also increased 6% for average medical services paid and 6.8% for average physician paid.
Litigation remains a consistent driver of claims costs, with litigated claims averaging three times more per claim than non-litigated claims. This highlights the importance of such measures as advocacy, timely communication that promotes understanding of the claims process, prompt payments and a focus on claim resolution and shortening durations.
Employee demographics are becoming increasingly important. The 60-plus age group has the highest indemnity rate at 28.3%. The increase in costs with claimants’ age can be attributed to delayed recovery and return to work, resulting in lengthier periods of lost wage payments. Employee wellness and incentive programs are ways some employers are encouraging healthier lifestyles and accentuating return to work.
Sedgwick is actively leveraging analytics, predictive modeling and artificial intelligence (AI) to enhance workers’ compensation programs and claims management through advanced technology. We enhance claims handling by using Bill ReviewIQ to deliver actionable analytics on legal spend, while AI-driven clinical insights from scanned medical documentation enable early referrals and streamlined care coordination — allowing claims professionals to focus on strategy and improving outcomes.