2025 MID-YEAR
Disability and leave of absence

Report Objectives
This report aims to summarize the present metrics for our disability programs, assess the landscape of disability claim administration and litigation, and benchmark our patterns against comparable industry research.
data parameters
Our practice team uses JURIS and TAMS claims data to perform comparative analyses informed by their expertise and analytics. The data in this report is based on the first half of each year, January through June, for each reporting year.
Certain client data is excluded from book of business metrics to avoid overrepresentation of a single client.
Key observations
Short-term disability incident rates dipped in mid-year 2025, but new claims increased slightly — driven by mid-career employees, those with longer tenure and common diagnoses like pregnancy and mental health. Meanwhile, leave volumes rose modestly while durations climbed more sharply, with medical and family leave making up the bulk of cases and keeping employees out of work longer.
10.9
Incident rate in mid-year 2025, a decrease from 11.1 in mid-year 2024
This aligns with typical mid-year patterns observed in both 2023 and 2024, where new claims tend to remain stable or fluctuate slightly.
.6%
Increase in new claim volume
A further rise in incident rates is anticipated by year-end. The 35-45 age group experienced the largest increase in new claim volume at 2%, while the 10-20 year length of service group saw the highest increase at 3.6%.
PREGNANCY
Remains the leading diagnosis group for new short-term disability claims, followed by mental/substance
These trends are consistent with national data from the U.S. Census Bureau and the Annual Disability Statistics Compendium (2025), which indicate a slight decline in short-term disability claims among younger workers under 35.
This may be attributed to increased workplace flexibility and improved access to mental health resources. Conversely, mid-career professionals aged 35-45 are experiencing higher claim rates, likely driven by increased stress, caregiving responsibilities and musculoskeletal conditions.
1.5%
Decrease in volume of mental health claims, which is consistent with typical mid-year dips
Overall, the top 10 diagnostic groups experienced a slight decline in new claim volume, likely reflecting seasonal trends
Leading diagnostic groups
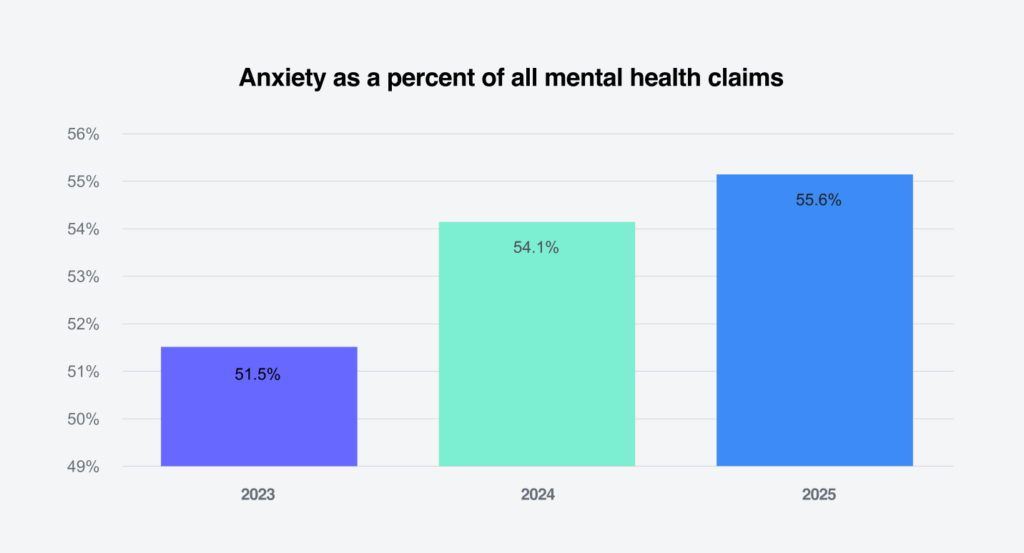
Mental/substance diagnoses continued to outpace musculoskeletal conditions as the top non-pregnancy diagnostic group. Mental health remained the second most common diagnosis across nearly all age groups, with anxiety accounting for 55.6% of mental health claims — up 2.8% from mid-year 2024. California, Texas, New York, Florida and Michigan lead in mental health claim volumes, with California showing the highest rates for anxiety and depression.
Claim durations and denials
Compared to mid-year 2024, closed claims increased by 1.9% in mid-year 2025.
- The average total approved days rose by 2.7%, with mental/substance claims showing a 2% increase in duration. Depression and anxiety durations also rose — by 2% and 1.7%, respectively.
- The 35-45 and 45-55 age groups had the largest increases in duration (1.2%), with pregnancy and mental health being the top diagnoses for 35-45, and musculoskeletal and mental health for 45-55.
- Length of service groups remained mostly stable, except for a 1.5-day decrease in the 3–5 years group and a 1.9% increase in the 20-plus years group.
Leave volumes and types
The new case count for stand-alone leave has remained stable, showing a modest increase of 1.8% from mid-year 2024 to mid-year 2025.
- Employee medical represented the largest share of new leave cases, increasing by 2.3% over the same period.
- Family leave experienced a slight decline of 0.6%. Together, these two leave types continue to account for most leave cases.
Approval rates and leave durations
The length of approved leave (LOAL) for continuous leave increased by 2.4% from 2024 to 2025, while intermittent leave durations rose by 3.6%.
- Continuous employee medical leave increased from 38.3 days in 2024 to 40.1 days in 2025.
- Military continuous leave saw a more substantial rise, from 49.2 to 56 days.
- Intermittent family leave also increased, from 12.5 days in 2024 to 13.3 days in 2025.
- Continuous leave for employees aged 55 and older increased from 39.4 days in 2024 to 41 days in 2025.
- Intermittent leave for this group also rose slightly, from 10.8 to 11.1 days.
Download a summary slide with these key observations.
REPORT CONTENTS
Short-term disability
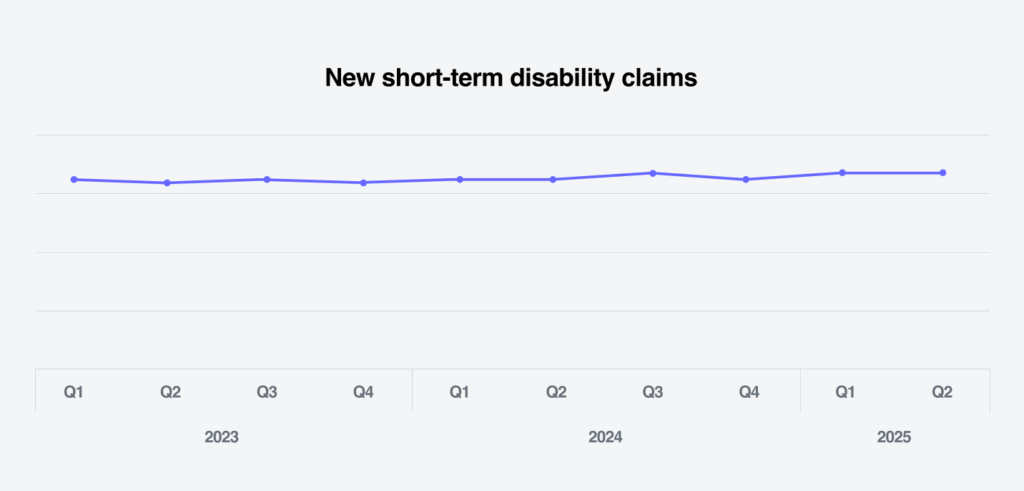
New claim volumes
Claim volumes increased
.6%
in 2025
In mid-year 2025, new short-term disability claim volumes increased 0.6% compared to mid-year 2024. That marks a 1.4% decrease from Q1 2025 to Q2 2025.
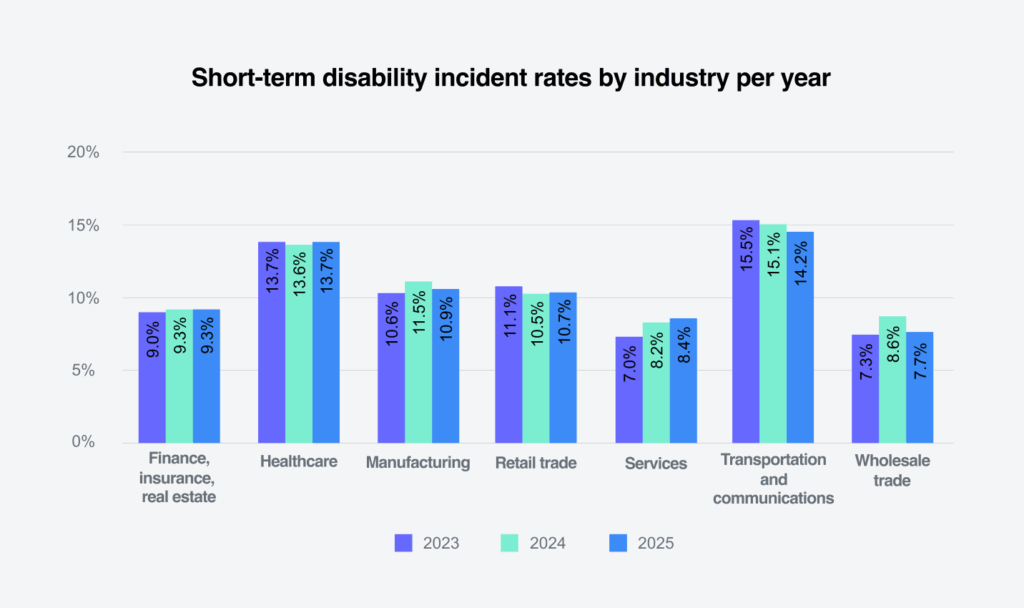
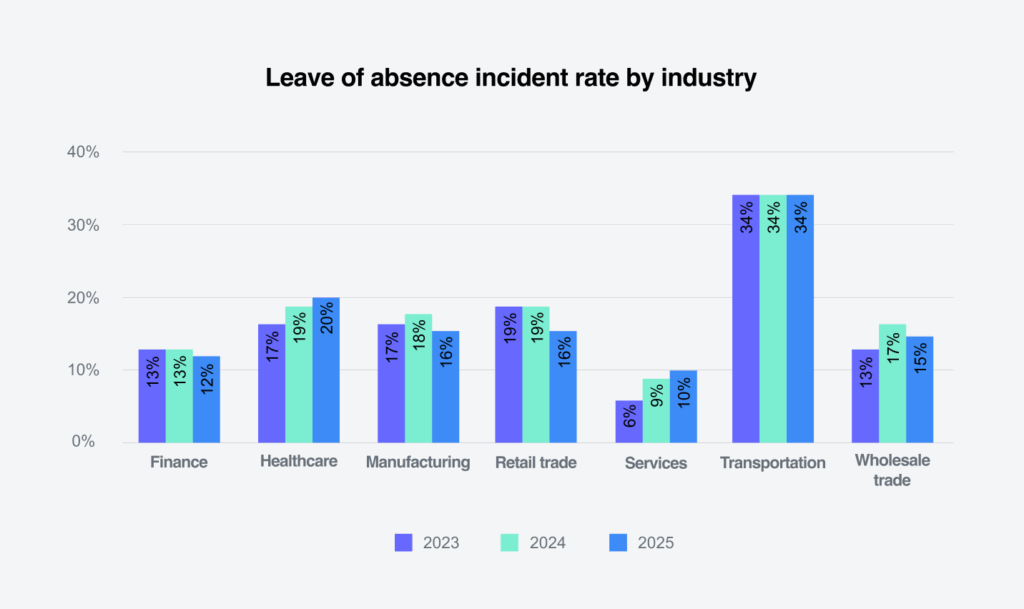
Incident rates by industry remained fairly consistent with FY 2024 data. Retail trade and services have increased slightly. These sectors should be monitored closely, as economic pressure from tariffs could lead to an increase in worker claims.
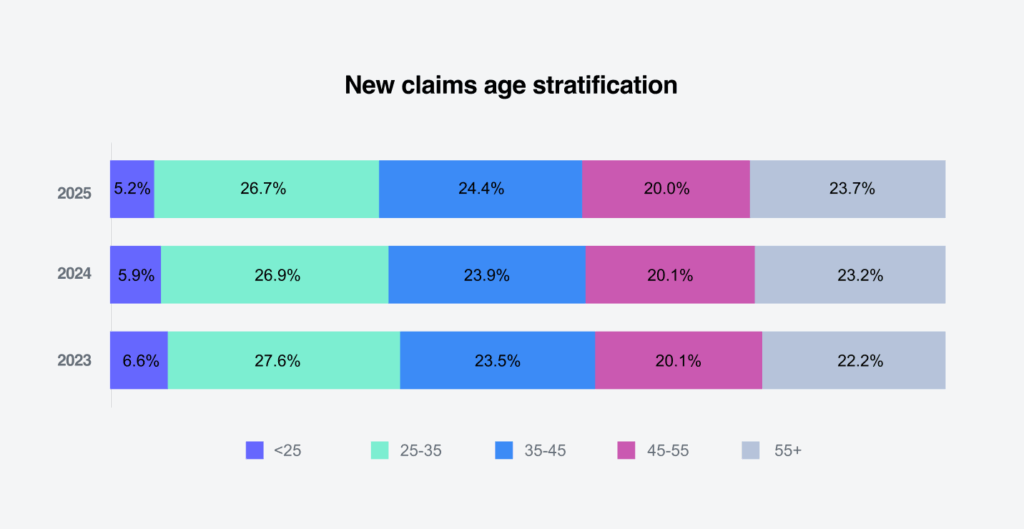
Incident rates by age
Incident rates by age range remained consistent. The under-25 age group incident rate decreased slightly, from 0.7% in mid-year 2024 to 0.6% in mid-year 2025. In the 25-35 age group (where pregnancy is the top diagnostic reason), the rate also decreased, from 3% in mid-year 2024 to 2.9% in mid-year 2025. The 35-45 age group was the only one to see a slight increase, going from 2.6% in mid-year 2024 to 2.7% in mid-year 2025, which we can attribute to rising mental health claims.

The 35-45 age group can also be seen as having the largest increase in new claim volume in mid-year 2025, with a rise of 2%.
New claims by age group
New claims by length of service group

New claims by diagnosis
In mid-year 2025, pregnancy was the top diagnosis for new claims in the under-25, 25-35 and 35-45 age groups. For the 45-55 and 55-plus age groups, musculoskeletal issues were the leading diagnosis for new claims.

Anxiety accounted for 55.6% of mental health claims in mid-year 2025, a 2.8% increase from 2024.
Additionally, anxiety is the primary diagnosis in mental health claims across all lengths of service, with the highest rate at 49% in the 10-20 and 20-plus years groups.

We examined the five highest states to see what the percentages of new mental health claims were. Across all states, except for California, depressive episodes and recurring episodes were the top claim reason. In California, this was slightly outpaced by phobic anxiety. Given the increase of mental health claims, we also compared our results against the states with the highest total temporary disability (TTD) for workers’ compensation, and California, Florida and Texas led the way with the highest TTD paid per day with inflation. We will be comparing data for our year-end State of the Line to see how mental health claims impacted our workers’ compensation volumes and whether the trends we’re seeing in workforce absence are starting to replicate those in workers’ compensation.

Closed claims
Closed claims increased 1.9% in mid-year 2025 compared to 2024. The average total approved days also increased 2.7% as compared to 2024 (including pregnancy). Excluding pregnancy, mental/substance was the top diagnosis code reasoning in mid-year 2025, with total approved days under this category increasing 2% from mid-year 2024. Closed volume for mental health increased by 9.6% in mid-year 2025 compared to mid-year 2024.

Looking at anxiety and depression, both diagnosis codes have increased in duration compared to the previous year. Depression has increased 2% and anxiety has increased 1.7%.

Total approved days
The average duration by age group showed a slight increase across all categories when comparing mid-year 2025 to mid-year 2024. The most notable changes occurred in the 35-45 and 45-55 age groups, which each saw a 1.2% increase. Specifically, the 35-45 group rose from 58.6 to 59.8 days, while the 45-55 group increased from 66.2 to 67.4 days.

The exception was the group with three to five years of service, which saw a decrease of 1.5%. The largest increase was observed in the 20-plus years of service group, where average duration rose from 72.2 days in mid-year 2024 to 74.1 days in mid-year 2025, a 1.9% increase.

Leave of absence
New volumes
(stand-alone unless otherwise specified)
Case count for stand-alone leave
+1.8%
The new case count for stand-alone leave has remained stable, showing a modest increase of 1.8% from mid-year 2024 to mid-year 2025.


While leave for their own serious medical condition remained the top leave reason overall, care for family members was the top reason for stand-alone leaves — which is a trend that’s consistent with 2024 leave data. Other leave reasons have decreased by 1.1% from 2024, which is consistent with previous mid-year results.

The number of stand-alone leave cases dropped mid-year for the under-25 age demographic as well as the 25-35 group. Stand-alone leaves increased slightly in the 35-45 group, but the over-55 group saw the largest increase. This trend is consistent with last year as more older workers remain in the workforce, and it will likely continue into 2026.

In our 2024 year-end State of the Line, we noted that impacts of the market realignment that occurred during COVID-19 were ending with regard to leaves filed by length of service. 2025 saw a significant decrease in leaves filed by workers with less than three years of service, and we saw a corresponding increase for workers with three to five years of service. We anticipate that leaves by length of service will start to revert to more normal patterns through the rest of the year and into 2026.

We noted in our workers’ compensation State of the Line in 2024 that according to the U.S. Bureau of Labor Statistics Current Population Survey, 19.5% of people aged 65 and older participated in the labor force (23.4% of men and 16.2% of women). In 1985, the labor force participation rate of people aged 65 and older was 10.8% (15.8% for men and 7.3% for women). Given the market shift during COVID, we’re seeing similar trends with workers whose length of service is lower but may be in an older demographic. We’ll continue to monitor to see if this trend continues.

Healthcare and transportation led all sectors for stand-alone leave incident rates, with healthcare showing a slight increase in stand-alone leaves. Typically, we see a slight pullback mid-year, but the increase in the services sector indicates that this trend may continue throuhgout the remainder of 2025 due to an increase in workers in that sector.
Case closure reasons

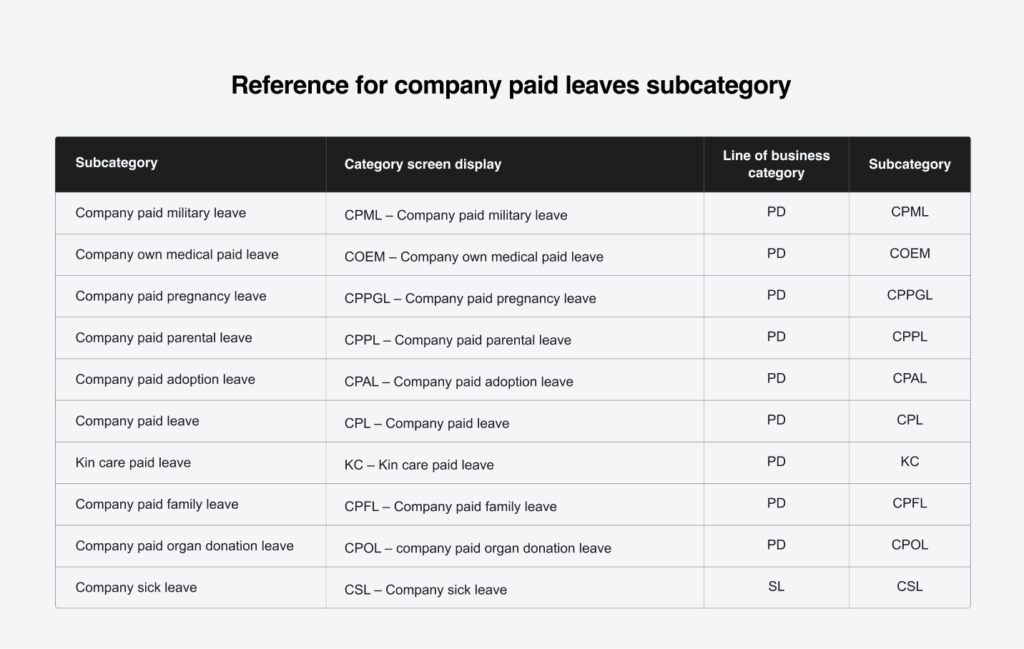
Company paid leaves
New volumes
1/4
of all company paid leave was family leave
Company paid parental leaves remained the top company leave reason, with a slight increase through mid-year 2025. This corresponded with a slight decrease in company paid family leave, which still accounted for almost 25% of all company paid leave and demonstrated that family leave remains a strong and growing company benefit.

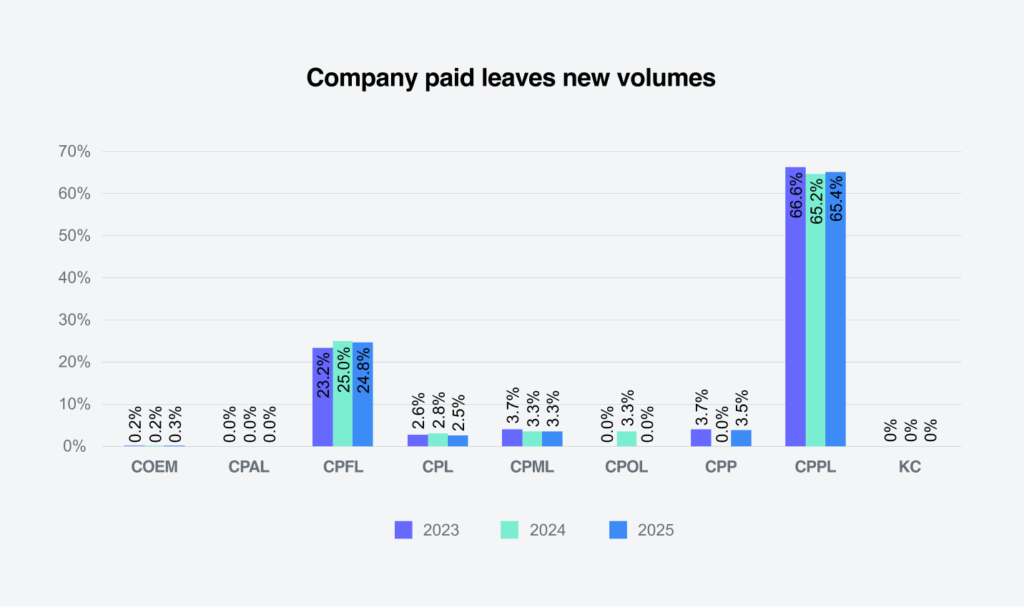
Please see the appendix for an explanation of the leave types.
Long-term disability
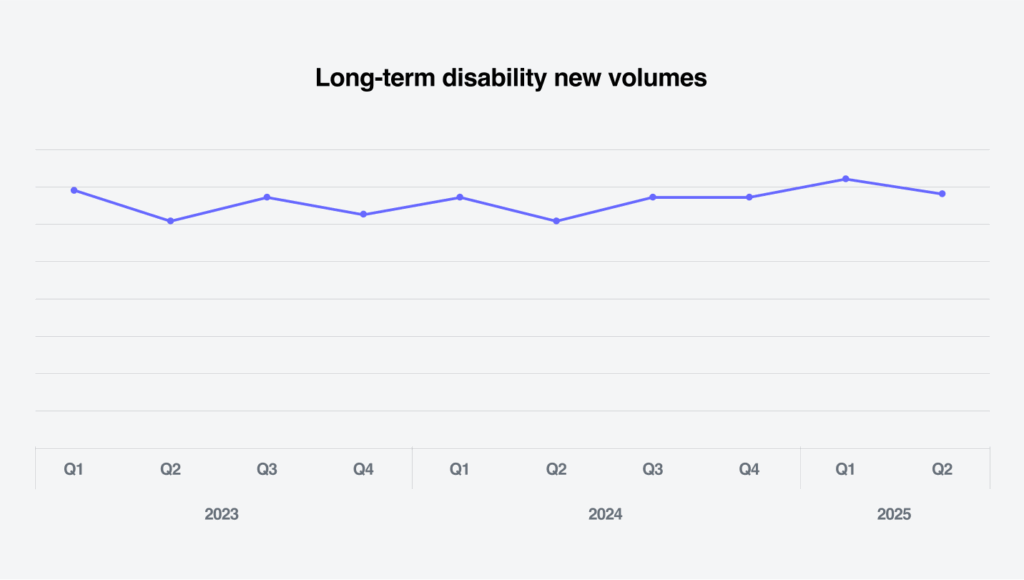
Long-term disability (LTD) volumes are up in the first half of 2025. They’re slightly above 2024 volumes and still above what we saw in 2023. We anticipate even more filings in the second half of 2025, consistent with past years.
Employees over 55 saw the largest increase in long-term disability claims. While this is traditionally the largest group in terms of claims volume, this represents the highest volume in almost three years.

We also saw increases for employees with 10-20 years and those with more than 20 years of service. We expect these volumes to grow as workers remain in the workforce longer. We’re also watching to see if this correlates with claims data from workers’ compensation based on length of service and age demographics.

Future considerations
Mental health provider shortage
The supply of mental health providers is decreasing. We’d noted that there would be a projected deficit of up to 31,000 psychiatrists by 2025, according to various psychiatric journals. The shortage has led to longer wait times and increased mental health claim durations based on 2024 reports.
NICU leave
Colorado has become the first state to add neonatal leave as a qualifying reason for its statutory paid family leave program. Depending on the final regulations, this could add an additional 12 weeks of potential time for leave under Colorado Family and Medical Leave Insurance (FAMLI) and increase care of family leaves. We could see changes to other paid family medical leave programs in 2026 and 2027.
Safe leaves
States like Oregon and Colorado are including provisions in their leave laws for employees to address immediate safety needs related to domestic violence and sexual assault. Minnesota’s Paid Family and Medical Leave program, starting in 2026, will also include this provision.
Caregiver leave
With one-third of the workforce acting as caregivers, there’s a growing expectation for employers to provide leave and support. This is especially relevant for the “sandwich generation,” who care for both their children and their aging parents.
DOL and PAID
The Department of Labor (DOL) announced in July of this year that it would be reviving the Payroll Audit Independent Determination (PAID) program, which was discontinued in 2021. The program was initially designed to allow employers to voluntarily report violations under the Fair Labor Standards Act (FLSA). It has been expanded to allow for voluntary violations under the Family and Medical Leave Act (FMLA). In 2024, the DOL reported approximately 350 investigations for violations of FMLA, which is consistent with prior years. We’ll be watching to see if the inclusion of FMLA under the PAID program impacts investigations into FMLA in 2025 and beyond.
Appendix