
2025 YEAR-END
Workers’ compensation

Report Objectives
This report aims to summarize the present metrics for our workers’ compensation (WC) programs, assess the landscape of WC claims and litigation and benchmark our patterns against comparable industry research. To aid our analysis, we utilized research from the following entities:
- National Council on Compensation Insurers (NCCI) research
- California Workers’ Compensation Insurance Rating Bureau (WCIRB) research
- Workers’ Compensation Research Institute (WCRI)
data parameters
Our practice team uses JURIS claims data to perform comparative analyses informed by their expertise and analytics. The data in this report is based on both insured and self-insured claims for all states across five, 12-month periods (referred to as CY) from Jan. 1, 2021, through Dec. 31, 2025.
Key observations
Workers’ compensation claim volume declined modestly, driven by reductions in both indemnity and medical-only claims. While overall claim frequency fell, claim severity increased. Operational performance remained stable; however, litigation trends showed upward pressure, including continued cost escalation within more complex claims.
1.6%
0.4%
decrease in indemnity claims from CY 2024 to CY 2025.
5.3%
increase in average paid per indemnity claim from CY 2024 to CY 2025, with the 18–29 age group averaging an 11.3% increase.
2.1%
decrease in medical-only claims from CY 2024 to CY 2025.
14.2%
litigation rate for indemnity claims, up from 13.1% the prior year.
The average incurred cost per litigated indemnity claim rose 2.5%.
The overall claim closure rate in CY 2025 was consistent with CY 2024 results.

Download a summary slide with these key observations.
REPORT CONTENTS
REPORT CONTENTS
Market
According to the AM Best Market Segment Report, Workers’ Compensation Continues with Strong Profits, Despite Pricing Cuts, workers’ compensation remains the primary driver of profitability for the overall property/casualty sector. This performance has continued even as net premiums written declined nearly 7%, reflecting rate reductions and ongoing pricing pressure.
The report, issued Oct. 7, 2025, also highlights several potential headwinds for the line, including:
- Susceptibility of payroll‑based exposure to macroeconomic shocks
- The possibility of a recession
- The impact of tariffs
- Shifts in immigration policy
- Legislative and regulatory changes
Finally, the report notes that California, which accounts for more than 20% of U.S. direct premium written — more than double that of any other state — has posted combined ratios above 100% for five consecutive years, exceeding 127% in the most recent year. These results reflect rising medical costs, increased litigation and growth in cumulative trauma claims, and may signal emerging trends for the broader national market.
In a separate report released in August 2025, Fitch Ratings projected a softening of workers’ compensation profitability, citing declining rates in recent years and the potential for rising claims costs driven by medical inflation, projecting combined ratios moving into the mid‑90s in the coming years.
A recent MarkWide Research report notes that the U.S. insurance third-party administrator (TPA) market is experiencing steady growth, supported by:
- Increased outsourcing of administrative functions by insurers
- Rising demand for specialized services
- Ongoing technological advancements
The report concludes that the market outlook is strong for TPAs that “embrace digital transformation, focus on compliance and risk management, enhance customer engagement, and invest in talent and training.”
Claim volume
1.6%
Decrease in total claim counts
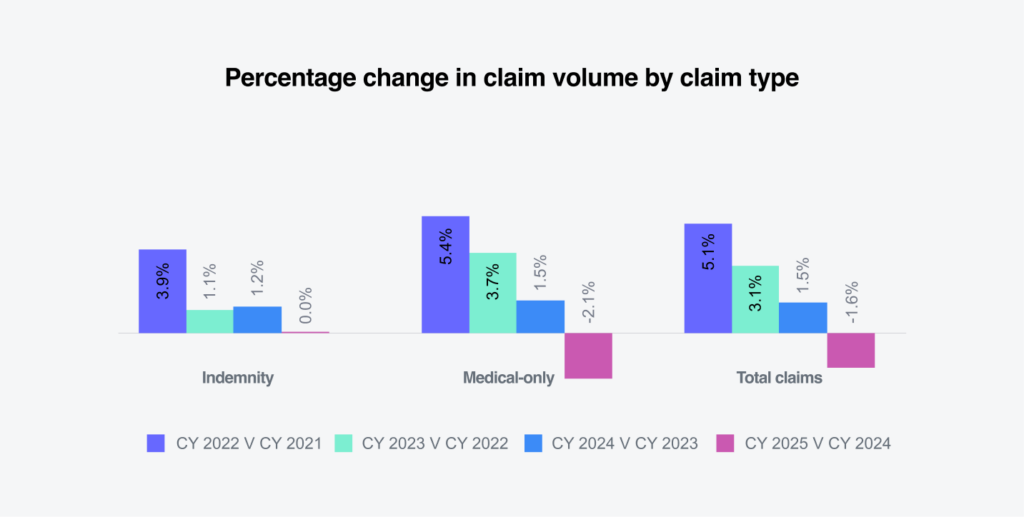
Sedgwick’s data for CY 2025 shows a 1.6% decrease in total claim counts compared with 2024. Indemnity claim volume was flat, while medical-only claims declined 2.1%.
The decline in claims can be partially attributed to slower job growth. According to the Bureau of Labor Statistics (BLS) TED: The Economics Daily Report published Jan. 16, 2026, payroll employment increased by 584,000 in 2025, an average monthly gain of 49,000. This compares with an increase of 2 million in 2024, or an average monthly gain of 168,000.
Additional support for declining claim volume comes from the BLS Economic News Release, Employer Reported Workplace Injuries and Illnesses, 2023-2024, published Jan. 22,2026. The report shows U.S. private industry workplace injuries fell in 2024 to their lowest level since 2003, the first year the BLS began tracking the data.
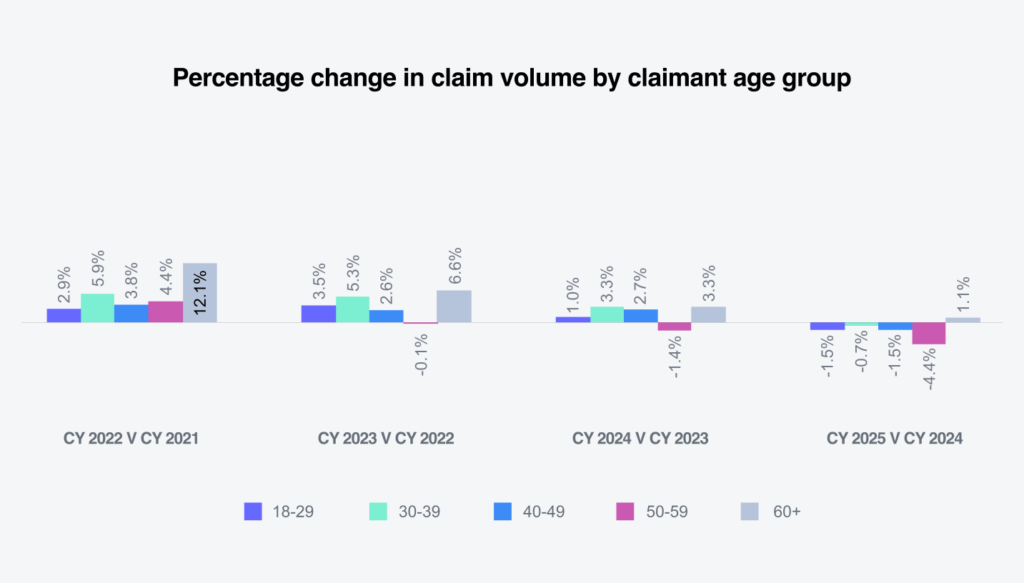
Sedgwick’s claim volume change by age group reflected trends consistent with the overall decline in total claims. The 60 and older age group was the only cohort to record a year-over-year increase, rising 1.1% from 2024 to 2025. Notably, this age group has posted the largest percentage increase in claim volume for five consecutive years, underscoring the ongoing impact of an aging workforce on claim patterns.
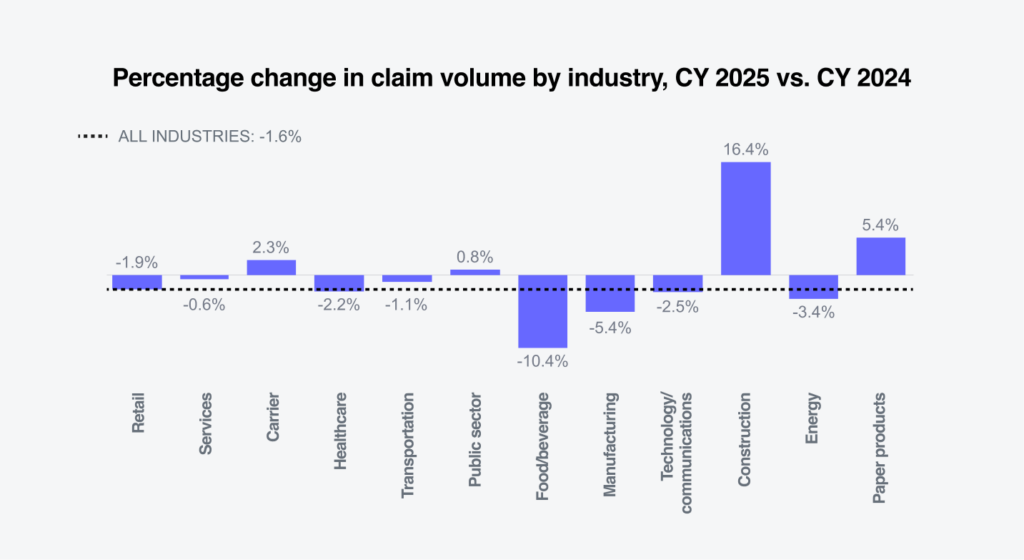
From an industry perspective, NCCI highlighted healthcare and social assistance as the strongest areas of labor market growth in its Labor Market Insights report published Jan. 9, 2026. In contrast, Sedgwick’s 2025 claim data counts were seen within the carrier, public sector, construction and paper products industries. The most significant declines in claim volume were recorded in food and beverage, manufacturing and healthcare.
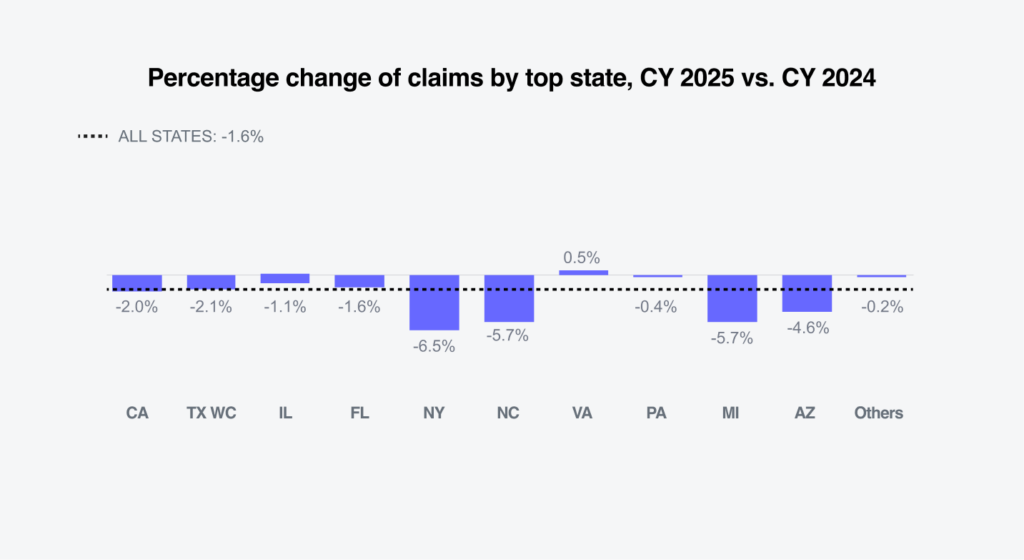
According to the Bureau of Labor Statistics (BLS) TED: The Economic Daily Report published Jan. 15, 2026, Texas, Pennsylvania, New York and North Carolina recorded the largest job gains from November 2024 to November 2025. The largest percentage increases in employment occurred in Missouri, South Carolina and North Carolina. Sedgwick’s data shows an increase in claims volume among top states only in Virginia. The largest declines in claim volume were recorded in New York, North Carolina, Michigan and Arizona.
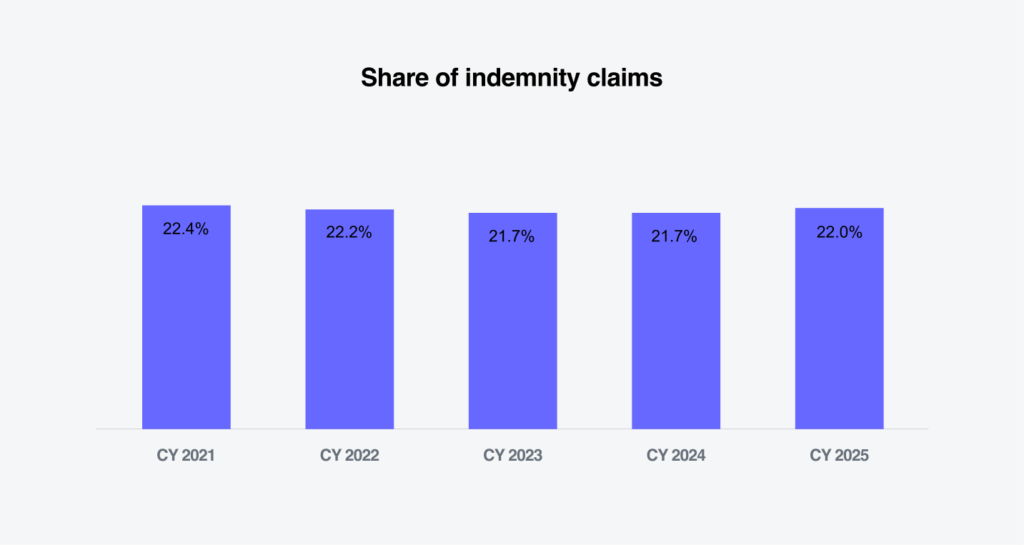
The share of indemnity claims compared with medical-only claims held steady at 22% in CY 2025, a 0.3% increase from CY 2024.
Shifts in the age distribution of the labor force are expected to have an increasing impact on workers’ compensation outcomes. According to Bureau of Labor Statistics (BLS) employment projections for 2023-33, the core of the labor force will continue to consist of workers ages 25-54. However, workers ages 65 and older are projected to experience the fastest growth in labor force participation. Their share of the labor force is expected to increase from 6.7% to 8.6% over the projection period, while the share of workers ages 16-24 is projected to decline from 13.2% to 11.6%.
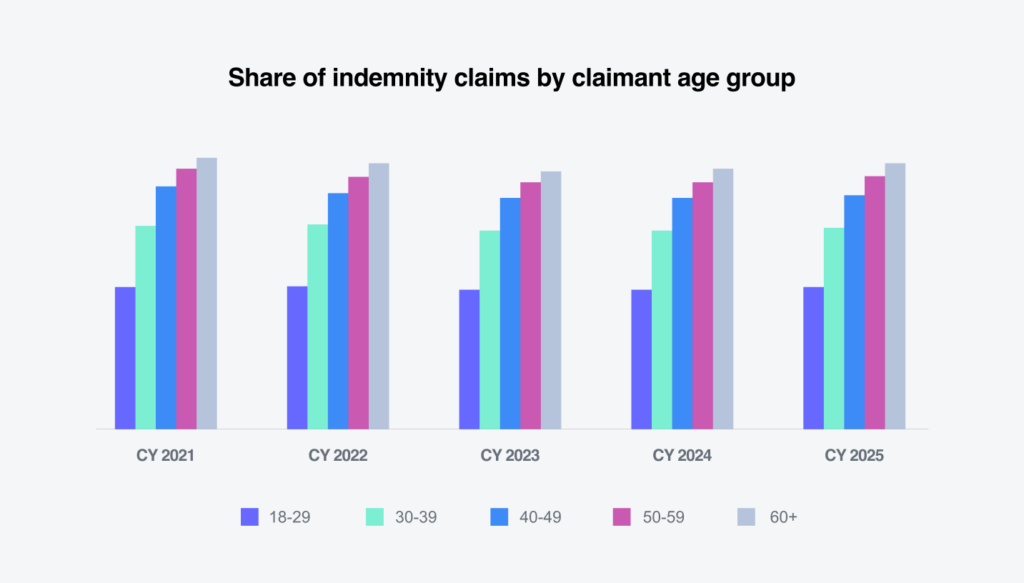
This demographic shift has important implications for claims severity. Sedgwick’s indemnity claim data by claimant age group shows that workers aged 60 and older continue to record the highest indemnity rate. In 2025, the indemnity rate for this age group increased to 28.5%, up from 27.9% in 2024, reinforcing the relationship between an aging workforce and higher-cost workers’ compensation claims.
Indemnity costs
5.3%
Increase in average paid
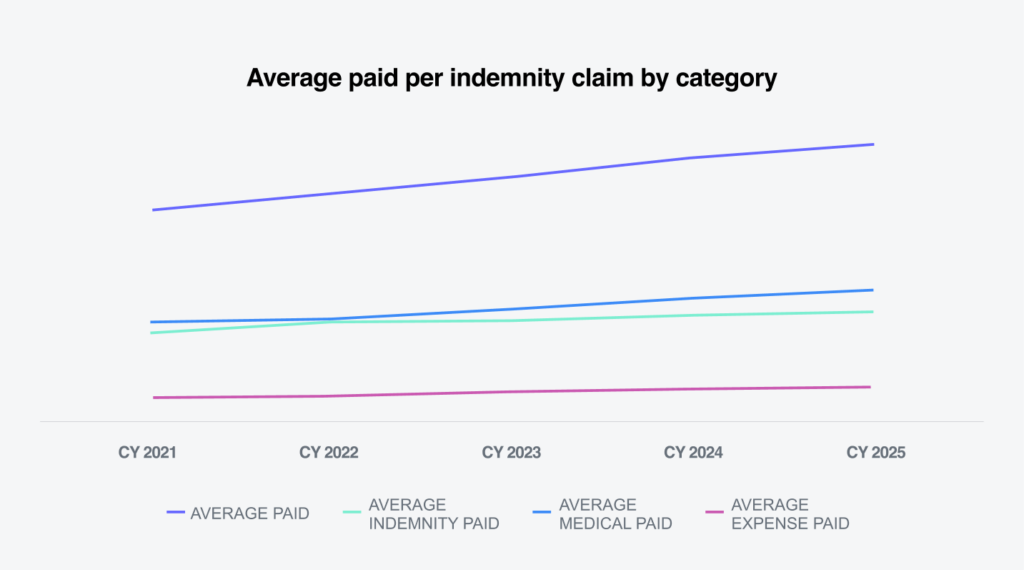
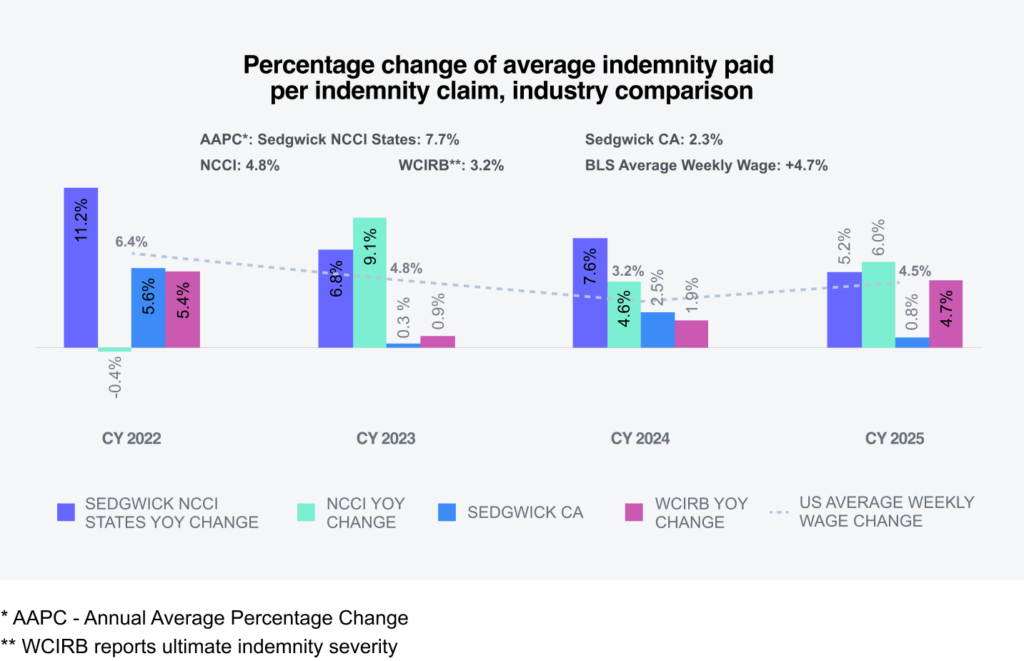
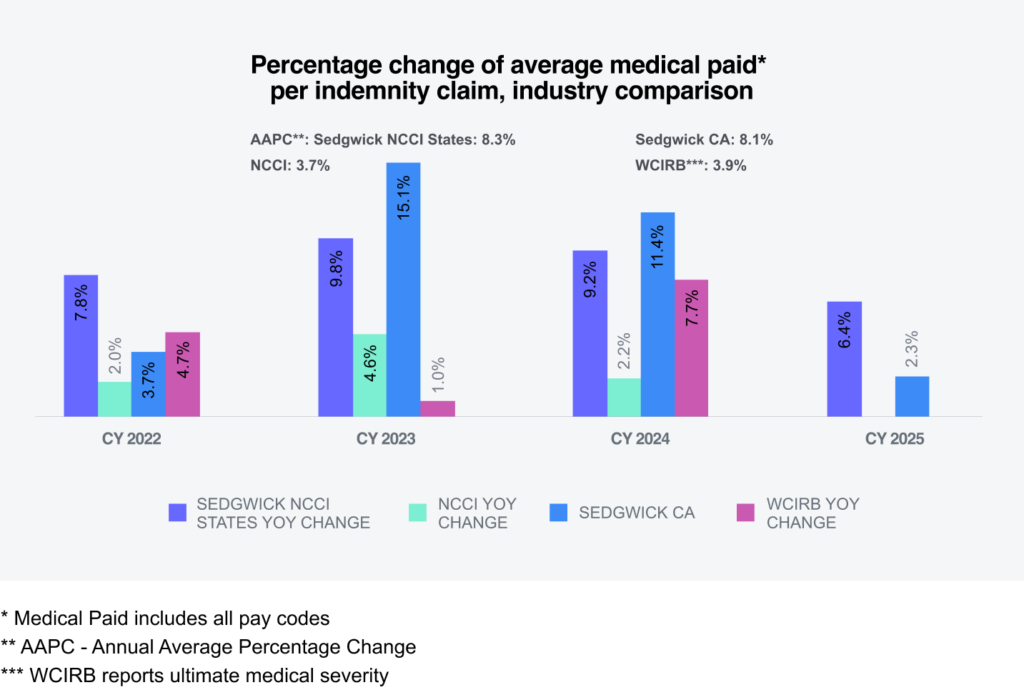
The average paid per indemnity claim increased by 5.3% from 2024 to 2025. The increase was driven by a 3.3% rise in indemnity payments, a 6% increase in medical payments and an 8.9% in expense payments.
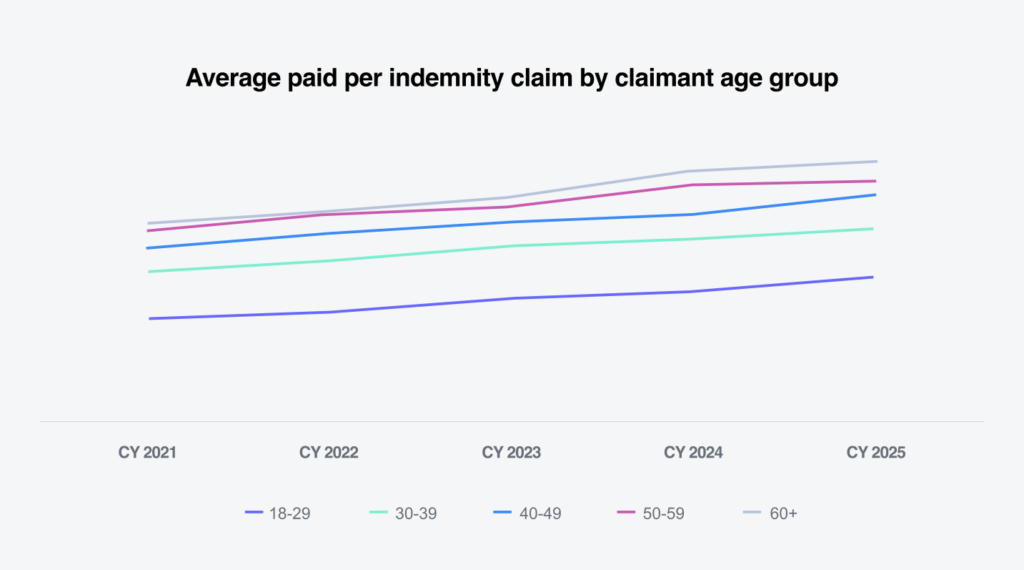
The largest increase in average indemnity paid occurred in workers ages 18-29, rising 11.3%. This was followed by increases of 8.7% among workers ages 40-49, 4.7% among those ages 30-39, 3.5% among workers ages 60 and older, and 1.6% among those ages 50-59.
While the 18-29 age group recorded the highest percentage increase, its overall financial impact remains more limited because of lower wage levels and reduced medical utilization compared with other age groups. In contrast, workers ages 60 and older, despite a smaller percentage increase, have higher average wages and significantly greater medical utilization, contributing more materially to claim severity and overall costs.
The state filter within the average weekly wage (AWW) Inflation Tool allows comparisons of average weekly wages by state. According to Employment Cost Index Summary – 2025 Q3 Results, issued Feb. 10, 2026, wages and salaries increased 4% for union workers and 3.3% for non-union workers for the 12 month period ending December 2025. In addition, 23 states and D.C. increased their minimum wage in 2025, and 21 states and D.C. are scheduled to implement minimum wage increases in 2026, according to The Economic Policy Institute’s minimum wage tracker.
Most states annually index their maximum indemnity benefit to the state average weekly wage (SAWW) to prevent inflation from eroding workers’ benefits. As a result, indemnity benefit costs vary by jurisdiction.
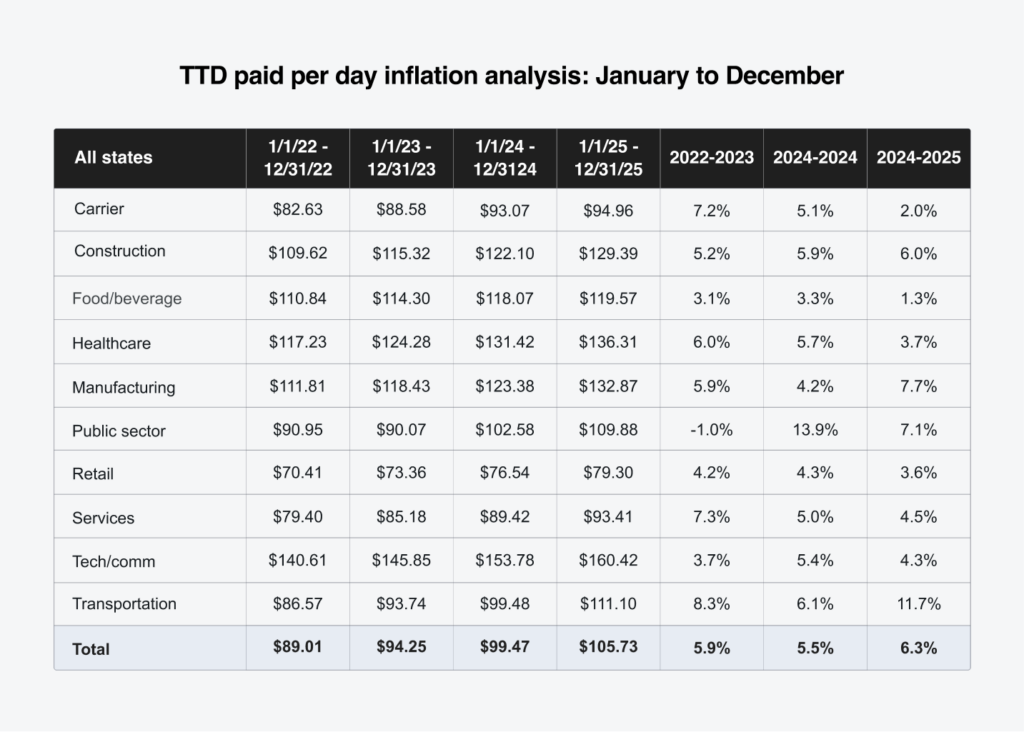
Our temporary total disability (TTD) paid-per-day inflation analysis shows a 6.3% increase for CY 2025 compared to CY 2024. The largest increases occurred in the transportation industry at 11.7%, followed by manufacturing at 7.7%, the public sector at 7.1% and construction at 6%.
Fourteen states recorded TTD paid-per-day inflation of 7% or higher, with New York posting the largest increase at 22%.
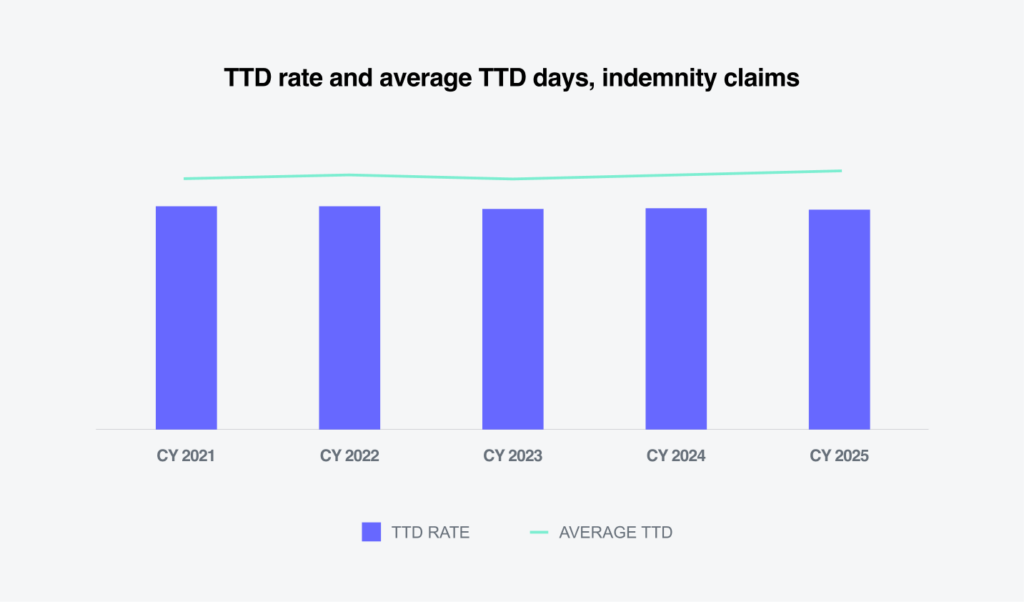
Since 2022, share of indemnity claims with at least one day of TTD payments has declined slightly year-over-year. This trend suggests that rising wages are contributing more to indemnity cost growth than changes in claim frequency.
Sedgwick’s year-over year-change in average indemnity paid per indemnity claim for CY 2025 cannot yet be directly compared with industry benchmarks. However, Sedgwick’s average paid per indemnity claim remains below projected levels reported by both NCCI and California.
Medical costs
5%
Increase in average paid
Sedgwick’s medical benefits, consistent with trends observed in most states, exceed indemnity benefits as a share of total claim costs.
In CY 2025, average medical services paid per claim increased 5% compared with 2024 across all categories of medical services. Physician services, which account for nearly 60% of Sedgwick’s medical spend per indemnity claim, increased 5.9% from 2024 to 2025. Spending on facilities — including hospital outpatient services, ambulatory surgical centers and hospital inpatient care — remains a significant driver of workers’ compensation costs and increased 3%.
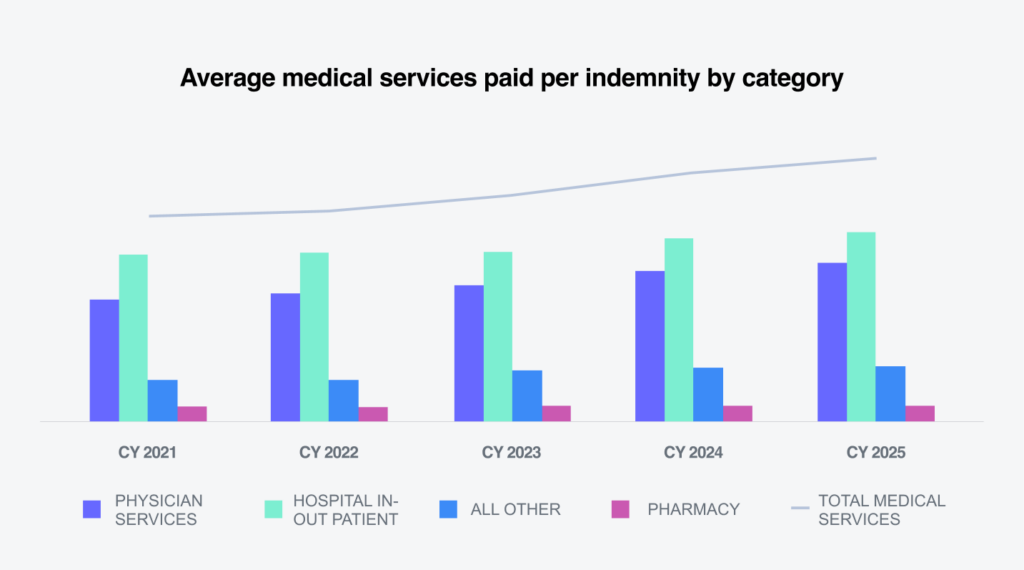
Because of the structure of workers’ compensation premium calculations, increases in medical costs represent a pure, uncompensated loss trend and are therefore closely monitored and actively managed.
Medical costs
Two factors drive changes in medical claims costs: the price of medical services and utilization, which reflects the mix and number of services provided to an injured worker.
Price
Sedgwick’s medical inflation analysis tool shows a 2.7% increase in the price per service between CY 2024 and CY 2025 across all states. The increase applied to evaluation and management, physical therapy, major and minor diagnostics and surgical procedures. The NCCI Medical Inflation Insights report issued Jan. 27, 2026, reported a 2.4% average increase in the workers’ compensation weighted medical price index (WCWMI). The index combines the producer price index (PPI) and the Consumer Price Index (CPI) and is reweighted using NCCI medical call data to better reflect the workers’ compensation spend mix.
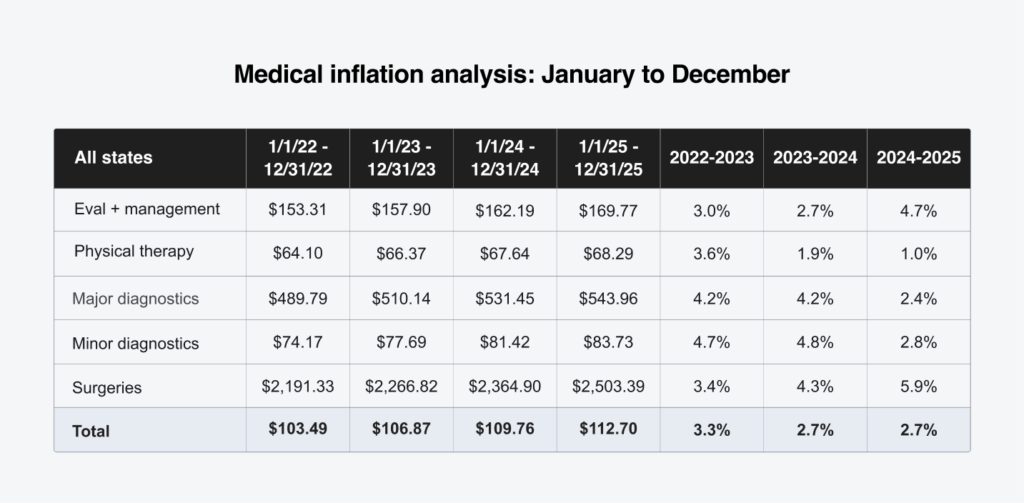
A deeper review of Sedgwick’s medical inflation analysis tool shows that surgical costs increased 5.9% in CY 2025 compared with CY 2024. In addition to filtering data by service group, the tool allows inflation analysis by state and state group:
- State: For example, in Florida, evaluation and management costs increased 58%, physical therapy costs rose 32% and surgical costs increased 7.7%. These changes are directly tied to the enactment of Senate Bill 362, which took effect Jan. 1, 2025:
- Increased the maximum reimbursement allowance (MRA) for physicians to 175% of the Medicare reimbursement rate, up from 110%.
- Increased the MRA for surgical procedures to a range of 140% to 210% of the Medicare reimbursement rate.
- State groups (fee schedule and non-fee schedule): The increase in the price per service was limited to 2.1% in states with a medical fee schedule. In contrast, states without a fee schedule for professional medical services — including Indiana, Missouri, New Jersey and Wisconsin — recorded increases that were 6.8%.
Impact of state fee schedules: Workers’ compensation medical reimbursement is highly regulated at the state level. Currently, 44 states and D.C. maintain fee schedules for physician and professional services.
While fee schedule approaches for physician and professional services vary widely by state, most are based on Medicare’s relative values scale. As a result, the impact of annual updates to Centers for Medicare and Medicaid Services (CMS) reimbursement rules and rates vary by state depending on:
- The medical service categories covered by state medical fee schedules
- The extent to which each fee schedule incorporates the CMS rules and rates
- The distribution of medical costs
States with established hospital fee schedules generally use one of the following methods to regulate hospital payments:
- Fixed-amount fee schedules: These states set specific maximum allowable reimbursements, often indexed to Medicare rates.
- Percent-of-charge regulations: Rather than a fixed dollar amount, these states cap reimbursement at a percentage of the hospital’s billed charges.
A study by the Workers Compensation Research Institute (WCRI), Hospital Outpatient Payment Index: Interstate Variations and Policy Analysis, 14th Edition, found that outpatient hospital payments for workers’ compensation grew faster in states with fee schedules based on a percentage of hospital charges than in states without fee schedules.
In 2025, Connecticut and Delaware enacted legislation to increase their state fee schedules in an effort to remove reimbursement rates as a barrier to physician participation in the workers’ compensation system. Wisconsin also passed legislation requiring the development and implementation of a hospital fee schedule effective July 1, 2027.
To maximize medical savings, Sedgwick’s bill review program, in conjunction with the application of appropriate state fee schedules, works to:
- Identify overcharges and correct coding discrepancies using advanced technology
- Apply PPO discounts through our broad network, when available
- Conduct direct negotiations with medical providers
Utilization
Utilization is the other primary determinant of medical costs, in addition to pricing factors. Multiple states have adopted policies and guidelines aimed at ensuring timely and medically necessary care for injured workers, which in turn affects the utilization of medical services.
Sedgwick’s proprietary claims systems include automated triggers designed to prompt timely action and collaboration among claims and managed care colleagues.
Differences in medical severity by age group
Average medical services paid per indemnity claim increases as employees age. For workers ages 60 and older, average medical services paid were more than 25% higher than the overall average for indemnity claims, highlighting the relationship between age and medical claim severity.
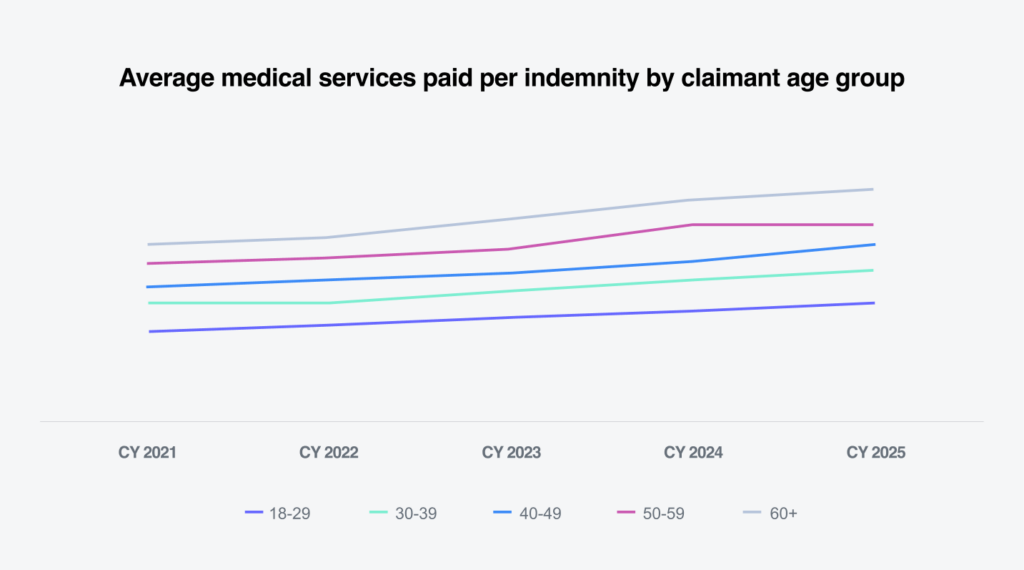
As people age, pre‑existing conditions and comorbidities often complicate and prolong medical treatment, increasing overall costs. According to the CDC’s National Institute for Occupational Safety and Health (NIOSH), older workers are less likely to experience workplace injuries; however, when injuries do occur — particularly after age 60 — they are more likely to be serious or fatal.
Closures
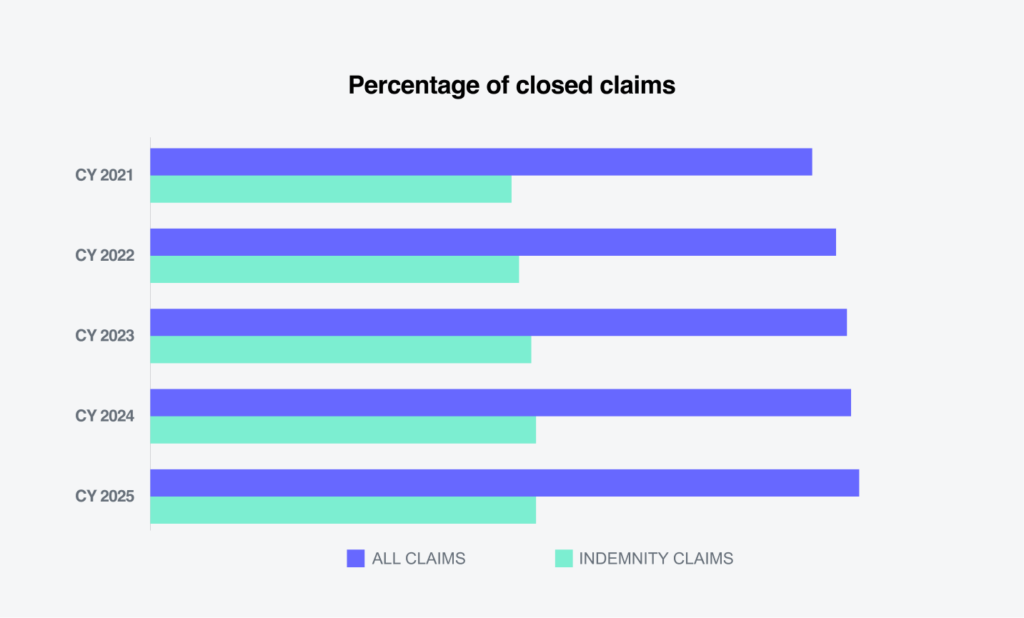
0.5%
Increase in all claims closed
The percentage of all claims closed in CY 2025 showed a slight improvement, increasing 0.8%. The closure rate for indemnity claims also rose, increasing 0.3%.
Expense costs
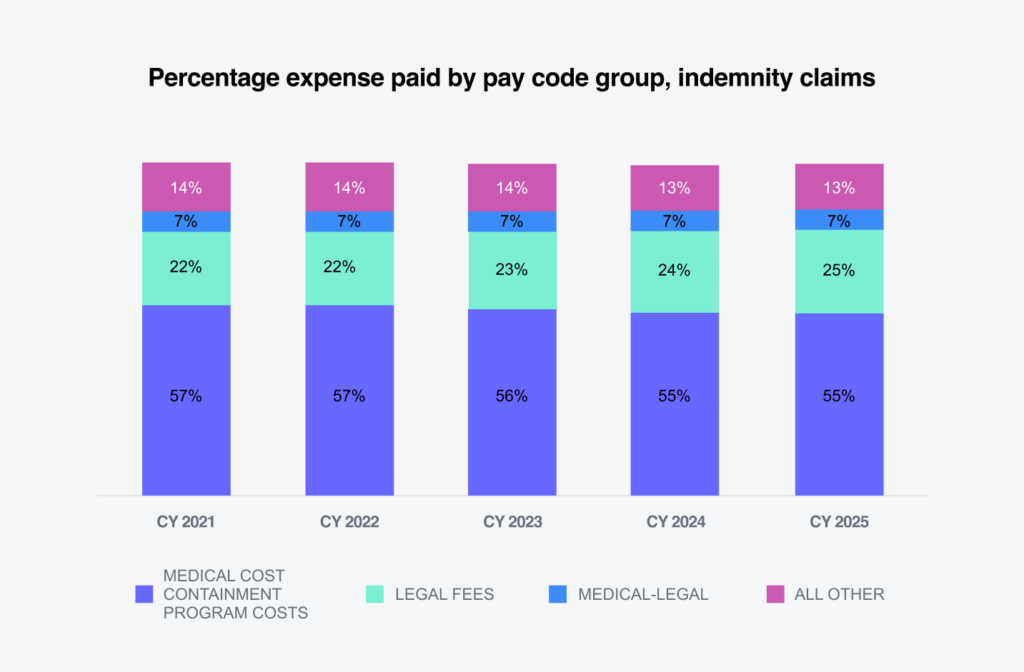
Allocated lost adjustment expense (ALAE) costs per indemnity claim consist of the following categories:
01
Medical cost containment program costs
Incurred to ensure that medical treatment is necessary, appropriately priced, aligned with evidence-based guidelines and compliant with state fee schedules, ultimately reducing the total medical spend on the claim.
02
Legal fees
Incurred in the defense or resolution of a workers’ compensation claim.
03
Medical-legal
Arise when medical expertise is required specifically for legal or adjudicatory purposes.
04
All other expenses
Additional claim-specific costs incurred to support accurate liability determination, fraud prevention and claim resolution.
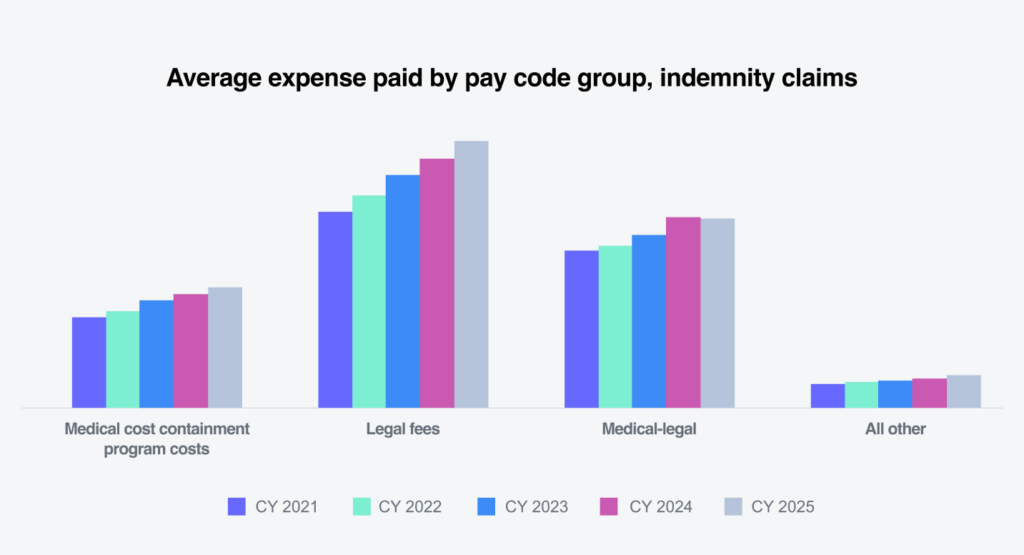
Expense cost distribution shifted modestly from CY 2024 to CY 2025, reflecting decreases in medical cost containment program costs and all other expenses, alongside increases in legal fees and medical-legal expenses.
In CY 2025, medical-legal expenses were the only category that did not increase compared with 2024. The all-other expense category recorded the largest increase at 11.4%, followed by legal fees at 7.5% and medical cost containment at 5.6%.
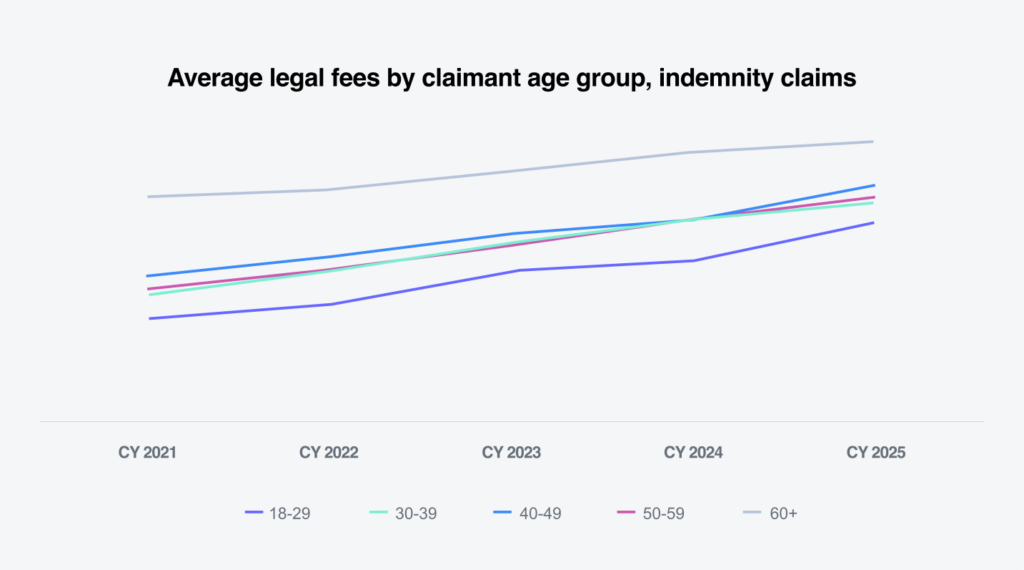
The age of the injured worker did not significantly impact the average legal fees for indemnity claims.
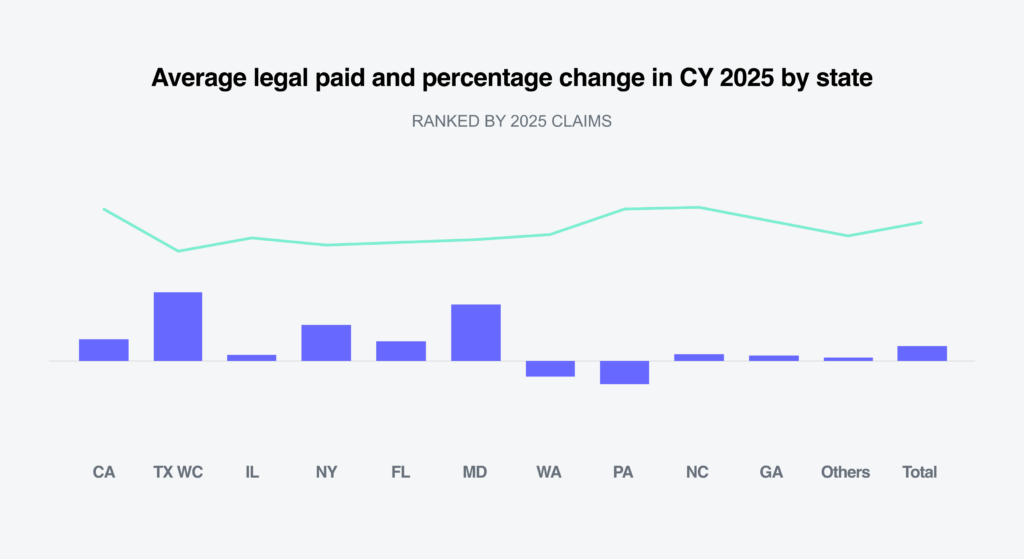
To enhance legal expense oversite, Sedgwick’s Bill ReviewIQ services for workers’ compensation programs provide robust legal bill review capabilities while delivering measurable savings and actionable legal insights.
Future considerations
Across medical, legal, regulatory and workforce dimensions, workplace changes in 2026 are fundamentally altering workers’ compensation.
Projected changes in occupational mix
According to the Bureau of Labor Statistics (BLS), employment growth between 2024 to 2034 is expected to be concentrated in occupations with both the highest and lowest rates of illness and injury:
- Healthcare and social assistance occupations, driven by both the aging population and a higher prevalence of chronic conditions.
- These jobs carry higher injury rates, particularly for strains, patient-handling injuries, slips and falls and workplace violence. Employment growth in these sectors increases exposure to complex musculoskeletal and cumulative trauma claims.
- Computer and information technology occupations, driven by demand for technology products and services.
- These roles are typically office‑based or hybrid, reducing frequency of traumatic injuries.
- However, ergonomic issues and mental stress claims may rise.
Workforce demographic shifts
- According to the U.S. Bureau of Labor Statistics, Current Population Survey, the labor force includes a record share of older workers. In 2025, 19.5% of adults ages 65 and older participated in the workforce, nearly double the 10.8% participation rate in 1985. While older workers experience fewer injuries, their injuries tend to be more severe and medically complex, driving higher claim severity, longer recovery periods and increased medical costs.
- Several states are expanding the types of work and hours permitted for workers ages 14-17, while others are tightening protections. According to NIOSH, younger workers experience higher job-related injury rates because of inexperience and concentration in higher‑risk industries. Increased youth employment is likely to elevate claim frequency.
- While work in offices, retail locations, warehouses and factories remains integral to many industries, remote and hybrid work continue to expand. According to TED: The Economics Daily published April 2, 2025, 24.9% of workers ages 25 and older teleworked or worked at home for pay during the first quarter of 2024. This shift has reduced some traditional injury types but may increase compensability disputes.
- Increased detention and deportation of undocumented immigrants is expected to contribute to workforce contraction, particularly in agriculture, construction and hospitality. This trend may also lead to fewer reported workplace injuries because of fear of deportation or employer retaliation. While immigration regulation falls under federal jurisdiction, eligibility for workers’ compensation benefits for undocumented workers is determined by state law.
Medical accessibility/costs
Medical costs and claim severity are expected to continue rising, driven by persistent challenges across the healthcare system. Key factors include:
- Nationwide physician shortages: According to The Complexities of Physician Supply and Demand: Projections from 2021 to 2036, published March 21, 2024, by the Association of American Medical Colleges (AAMC), the U.S. could face a shortage of up to 86,000 physicians by 2036. This shortage spans nearly all specialties, including primary and nonprimary care. The National Center for Health Workforce Analysis’ 2024 projections similarly anticipate shortages in 31 of 35 physician specialties by 2037, although expanded use of nurse practitioners and physician assistants may partially offset gaps in certain fields.
- Increasing health care consolidation: Continued mergers and acquisitions among hospitals, health systems and private equity‑backed providers are contributing to higher costs. A report issued Jan. 15, 2025, by the U.S. Department of Health and Human Services in response to the Consolidation in Health Care Markets Request for Information (RFI) highlights the significant impact of market consolidation and investment activity on healthcare prices and access.
- Aging workforce with more chronic conditions: As the labor force ages, workers present with more comorbidities and require more intensive and prolonged medical treatment. These factors directly contribute to higher claim costs and longer recovery durations.
- Emergence of advanced medical technologies: Innovations such as robotic surgery, biologics, advanced imaging, implantable devices and new pain management techniques are reshaping clinical care for injured workers. While many of these advances improve outcomes, they are also significant contributors to rising medical costs and increased claim severity in workers’ compensation.
Workers’ compensation is not immune to these trends. Recognizing medical cost drivers and developing strategies to manage and mitigate associated costs remain critical.
Technology transformation
Technology is playing an increasingly influential role in shaping the future of workers’ compensation. Artificial intelligence, automation and digital health tools are no longer emerging concepts. They are actively reshaping core processes today. Strategic adoption across several key areas has the potential to enhance efficiency, improve outcomes and reduce overall claim costs:
- Artificial intelligence: AI is streamlining claims processing, enhancing decision‑making and strengthening fraud detection, helping reduce claim costs and operational risk.
- Telemedicine: Virtual medical consultations are expanding access to care for injured workers, improving convenience, accelerating early intervention and reducing delays in treatment.
- Wearable technology: As wearable devices become more sophisticated, real‑time data on worker movement, ergonomics and environmental conditions can help prevent injuries, support safer return‑to‑work planning and reduce long‑term claim costs.
Together, these technological advancements present both new challenges and significant opportunities, positioning the industry for more proactive, data‑driven and worker‑centric approaches to claims management.
Marijuana rescheduling
On Dec.18, 2025, President Donald Trump signed an executive order titled, Increasing Medical Marijuana and Cannabidiol Research, directing the U.S. attorney general to take all necessary steps to complete the rulemaking process to reschedule marijuana from Schedule I to Schedule III of the Controlled Substances Act of 1970 (CSA) in the most expedited manner consistent with federal law.
Under the CSA, Schedule I drugs are defined as having no accepted medical use and a high potential of abuse, while Schedule III substances include ketamine and products containing codeine.
Until the DEA issues and publishes a final rule in the Federal Register, federal law remains unchanged. Any final rule is also expected to face legal challenges.
2026 elections
Elections across the U.S. will take place primarily Nov. 3, 2026. Voters will determine the composition of the 120th Congress, with all 435 seats in the U.S. House of Representatives and 35 of the 100 U.S. Senate seats on the ballot. In addition, 36 states will hold gubernatorial elections, along with numerous state and local contests nationwide.
In 2026, four states will also elect an insurance commissioner:
- California
- Georgia
- Kansas
- Oklahoma
Election outcomes are expected to influence workers’ compensation policy, as the system is governed largely at the state level, while federal policy shapes the broader labor and economic environment.
As the workers’ compensation landscape continues to evolve, Sedgwick remains focused on using data, technology and expert resources to reduce claim severity, control costs and improve outcomes for injured workers and employers.
Conclusions
2025 continued another year of favorable trends for the workers’ compensation industry with loss ratios remaining strong.
While workers’ compensation continues to be the most profitable segment of the commercial property and casualty insurance line, several potential headwinds are emerging. Profitability is expected to soften as rates continue to decline and claim costs show signs of upward pressure. As a result, maintaining diligence and operational discipline will be critical to sustaining positive outcomes heading into 2026.
- Claims volumes declined while claim costs increased. Overall claims costs rose 5.3% in CY 2025, driven primarily by inflation, including a 6.3% increase in disability daily rates and a 2.7% increase in medical costs. Increased utilization of certain medical services also contributed to higher costs, including a 5.9% increase in surgeries and a 4.7% increase in evaluation and management services.
- Litigation remained a consistent driver of claims costs in CY 2025. Legal fees increased 7.5% and litigated claims cost an average of three times more than non-litigated claims. Proactive strategies — such as early advocacy, timely communication and clear explanations of the claims process — are essential to preventing claims from becoming litigated. For claims that do go to litigation, aggressive claims management, a strong focus on timely settlement and efforts to shorten overall claim duration remain critical to controlling costs. Data-driven litigation analytics are essential to achieving cost-effective outcomes. Sedgwick’s attorney scorecard and Bill ReviewIQ provide actionable insights into litigation costs and performance, enabling more precise attorney selection, oversight and cost-containment strategies.
- Employee demographics continue to play a significant role in driving claim costs. The share of workers ages 65 and older is projected to increase from 6.7% to 8.6% by 2033, expanding the portion of the workforce associated with higher‑severity claims. Medical services paid for claimants in this age group average 25% more than the overall medical paid per indemnity claim. These higher costs are largely driven by slower recovery times, delayed return‑to‑work outcomes and longer durations of wage replacement.
As the workforce continues to age, employer strategies that promote health and reduce injury risk become increasingly important. Robust wellness initiatives, safety programs and lifestyle incentive efforts can help prevent injuries, while strong return‑to‑work programs can mitigate lost‑time exposure and moderate long‑term claim costs.
Sedgwick is actively leveraging analytics, predictive modeling and artificial intelligence to elevate workers’ compensation programs and enhance claims management through advanced technology. Bill ReviewIQ®, nurse triage, telemedicine, behavioral health support, ergonomic services and specialized provider networks work together to control medical costs, improve access to care, support faster and safer recoveries and manage ALAE effectively.
Sedgwick’s integrated workers’ compensation model is designed for continuous improvement. Through tools such as Sidekick®, we use predictive analytics to identify risk early and guide claim handlers to the right actions and resources at the right time. The emphasis is on technologies that enable claims professionals to focus on strategy, informed decision-making and improved overall claims outcomes.
2025 YEAR-END