
2025 YEAR-END
General liability

Report Objectives
This report aims to summarize the present metrics for our general liability (GL) programs, assess the landscape of GL claims and litigation, and benchmark our patterns against comparable industry research.
data parameters
Our practice team uses JURIS claims data to perform comparative analyses informed by their expertise and analytics. The data in this report is based on both insured and self-insured claims for all states across five, 12-month periods (referred to as CY) from Jan. 1, 2021 through Dec. 31, 2025.
Key observations
GL claim volume continues to rise, driven more by property damage than bodily injury. Claim severity is increasing faster than claim volume, with both paid and incurred amounts accelerating at a pace that exceeds inflation.
Litigation activity is becoming more prevalent across both new and pending claims, particularly for bodily injury. Attorney involvement is happening earlier in the claim life cycle and is becoming more common even among claims that do not ultimately go to litigation. Pending litigated claims are growing significantly more expensive, reaching their highest levels in recent years. Although litigated claims represent a small portion of total closures, they dominate total payouts and carry substantially higher average costs than non-litigated claims.
2.2%
increase in GL claim volume in CY 2025. Property damage claims grew faster (+4.7%) than bodily injury claims (+1.2%), consistent with a five-year average annual increase of 2.3%.
SERVICES AND RETAIL
are the sectors that continue to lead in bodily injury claim rates, at 54.9% and 49.8% respectively, well above the average of 39.6%.
11%
increase in bodily injury incurred severity in CY 2025 after a brief decline in CY 2024.
The five-year average annual percent change (AAPC) of 9.7% is over three times the general inflation rate.
10.6%
increase in the average paid per new GL claim in CY 2025.
Average paid severity is accelerating faster than claim growth with a five-year AAPC of 14.4%, significantly outpacing inflation.
25.7%
increase in the average incurred for pending litigated GL claims.
These claims are becoming significantly more expensive, reaching the highest level in five years.
0.95%
increase in overall litigation rate for new GL claims.
The new GL bodily injury litigation rate increased to 1.84%. A similar trend is evident in pending GL claims, with the pending litigation rate rising to 24.8%.
Attorney engagement
Attorney engagement is occurring earlier and more frequently, with 71% of litigated claims represented within 24 hours of claim filing. Non-litigated bodily injury attorney representation increased to 24.9%, up 2.7 points year over year.
Jurisdictional risk
High-severity claims
Driving a disproportionate share of total cost, claims of $25,000 and above represent 54% of total incurred dollars and just over 2% of new claim volume.
Litigated claims
Litigated claims, though a small portion of closures, dominate total payouts, representing 5.76% of closed claims but nearly 70% of total dollars paid, with an average cost 37.5 times higher than non-litigated claims.

Download a summary slide with these key observations.
REPORT CONTENTS
REPORT CONTENTS
Market
AM Best
Social inflation remains a dominant driver of GL loss severity and underwriting strain. AM Best highlights elevated casualty claims linked to social inflation, with adverse implications for underwriting and reserve margins.

Swiss Re
Juror sentiment continues to shift in favor of plaintiffs. The 2025 behavioral study finds that in severe-injury cases, jurors may recommend high compensation against small and midsize enterprises nearly as often as against large corporations, an important consideration for fleet and small-business insureds.

Financial Times
Concerns are growing around liability market availability and capacity. Market participants warn of the potential constraints in parts of U.S. liability market. A Financial Times report describes U.S. commercial liability as nearing a potential “breakdown,” citing insurers’ concerns over legal system abuse, continued price increases and greater use of exclusions and limit management.
NCCI
Medical price inflation may reaccelerate after a temporary breakdown. NCCI’s Medical Inflation Insights (October 2025) notes that price growth moderated in 2025 largely due to softening hospital services pricing, but expects the trend to be temporary, with hospital services returning to the 4% to 5% range, and overall medical inflation moving closer to 3% compared with about 2.5% at the time.
Marsh
General liability pricing pressure persists despite broader market softening. Marsh reports overall declines in global commercial insurance rates, but multiple Marsh index summaries show casualty lines remains an outlier, with continued upward pressure driven by an increasingly litigious environment.
Volume
+2.2%
IN CY 2025
GL claim volume increased by 2.2% overall in CY 2025, driven by growth in both bodily injury and property damage claims.
Bodily injury (BI) claim volume rose 1.2% from the prior year, while property damage (PD) claim volume increased 4.7%. Over the past five years, the average annual percentage change was 2.3%.
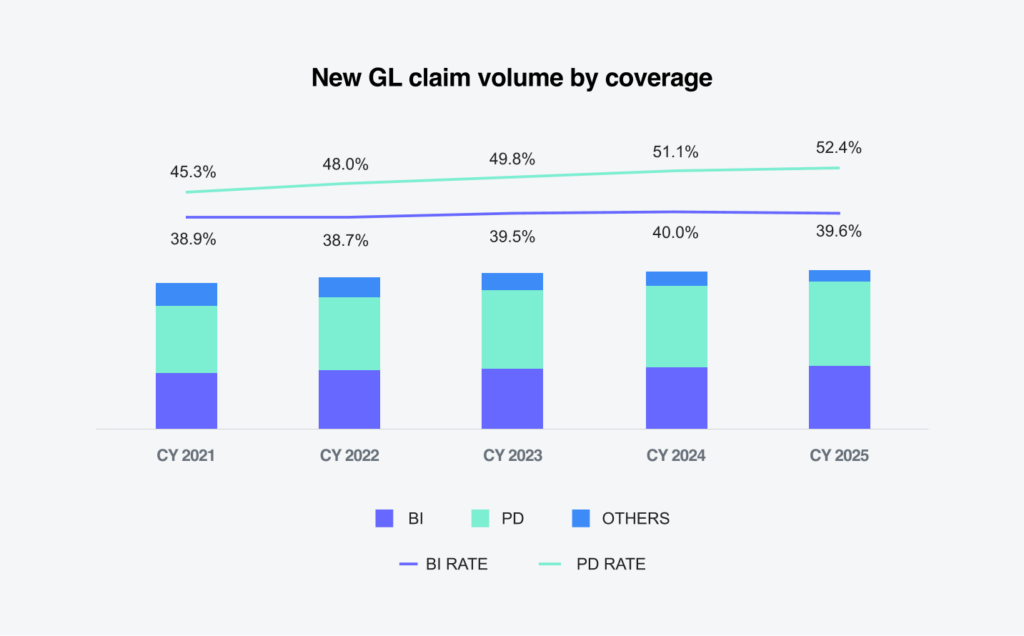
For the third consecutive year, the services and retail sectors recorded the highest rates of GL bodily injury claims, at 54.9% and 49.8%, respectively. The overall average bodily injury claim rate was 39.6%, down slightly by -0.4% from CY 2024.
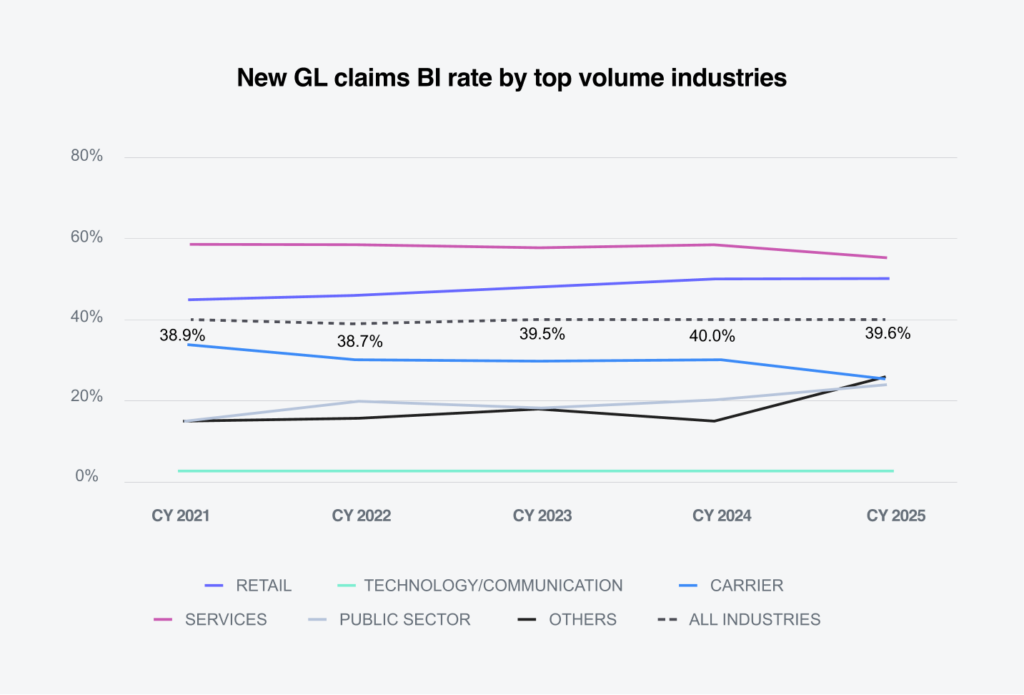
California, New York and Florida reported new GL bodily injury claim rates above the all-state average of 39.6%, at 53.1%, 50% and 42.1%, respectively. Florida and Georgia, both of which recently enacted comprehensive tort reform, recorded declines in bodily injury claim rates, down 2.1% and 0.5%, respectively. Florida has now posted two consecutive years of decreases.
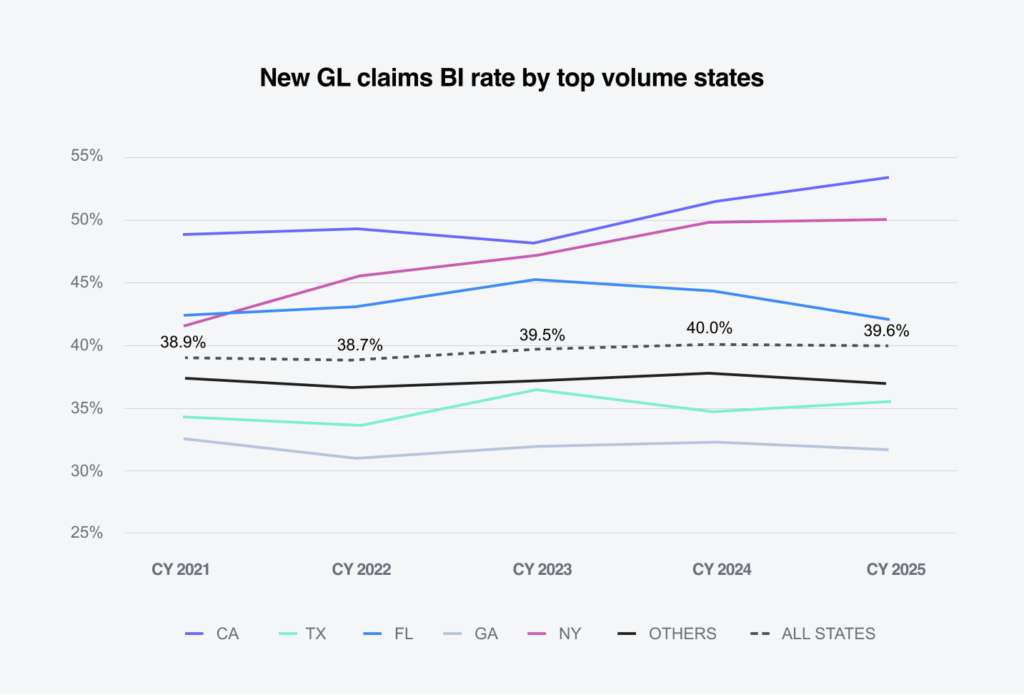
Within the property damage line, the average property damage claim rate across all industries increased 1.3% to 52.4% over CY 2024.
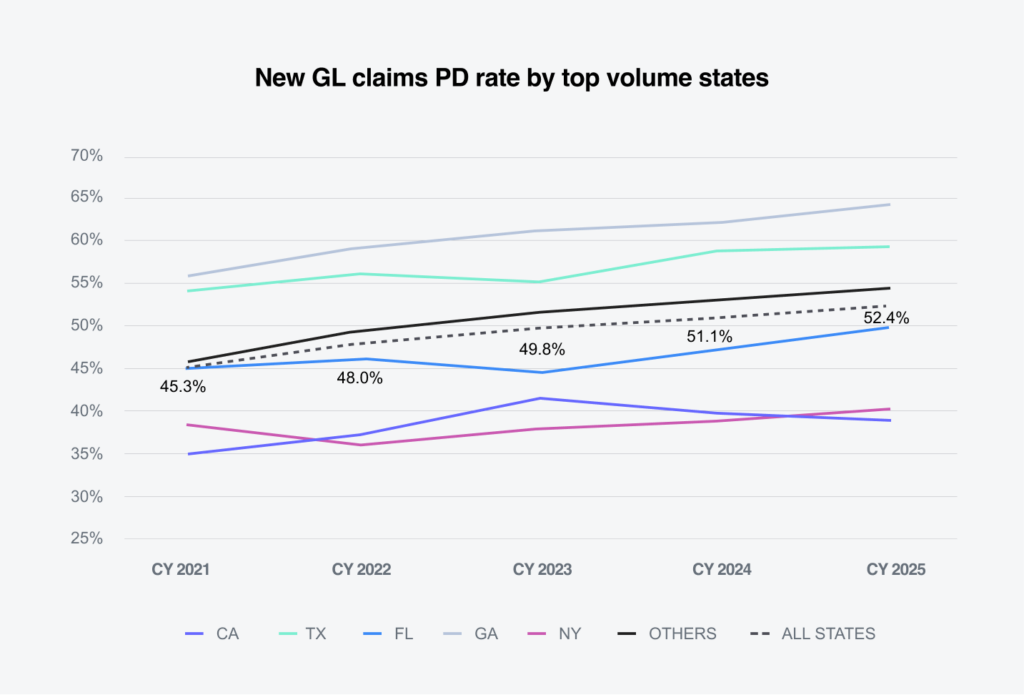
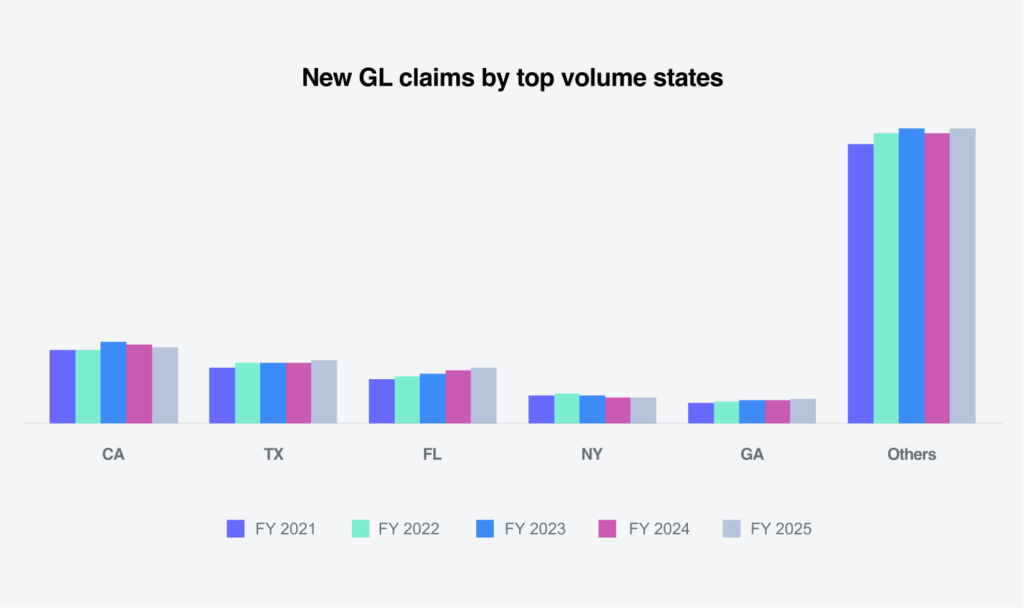
The states with the highest volume of new GL claims were California, Texas, Florida, Georgia and New York. Combined, these five states accounted for 42.5% of total new GL claim volume.
Costs
10.6%
increase in average paid
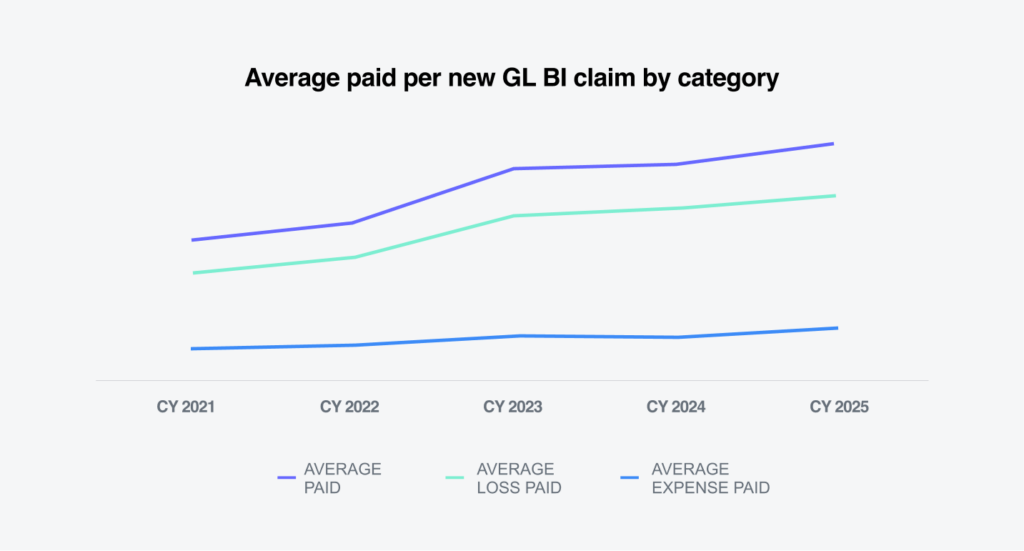
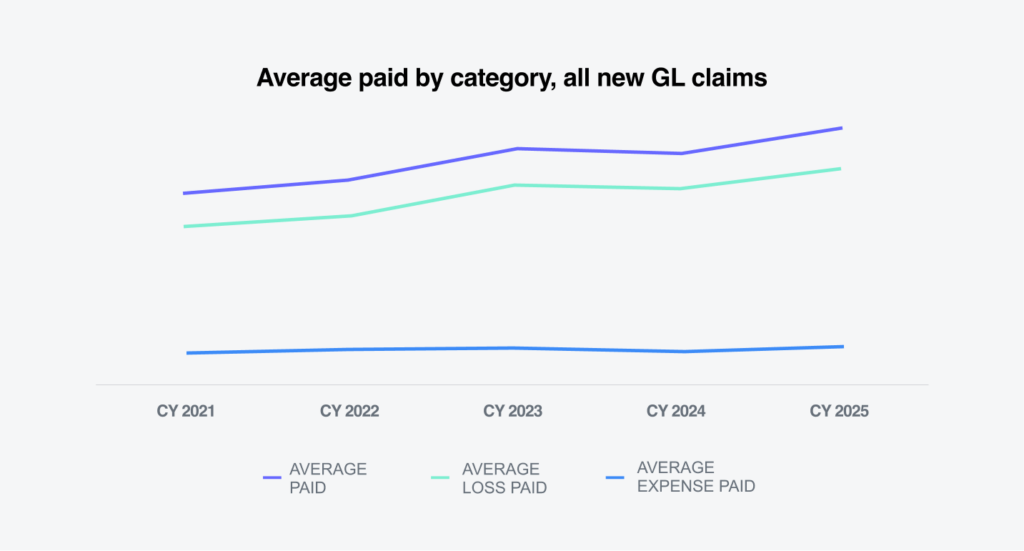
The average paid for all new GL claims increased 10.6% in CY 2025. Average loss paid rose 10%, while average expense paid increased 13.7%. For bodily injury claims, the average paid increased 9.9%, and average loss paid rose 6.8%. Since CY 2021, the average annual increase in average paid has been 14.4%.
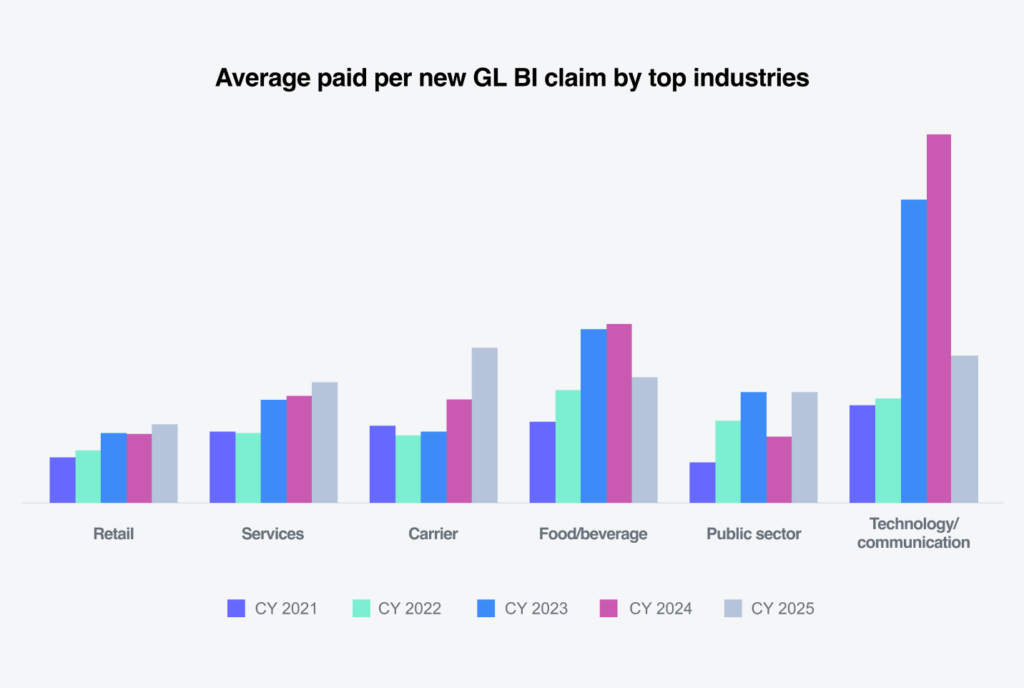
The average paid per new GL bodily injury claim increased in the retail, carrier and public sector categories, rising 13%, 51% and 66%, respectively. The carrier group now reports the highest average paid per bodily injury. Increases in the public sector and carrier categories primarily reflect volume shifts rather than material changes in claim severity. In contrast, the increase in retail average paid is more significant and reflects the combined effects of social inflation, medical inflation and plaintiff bar tactics.
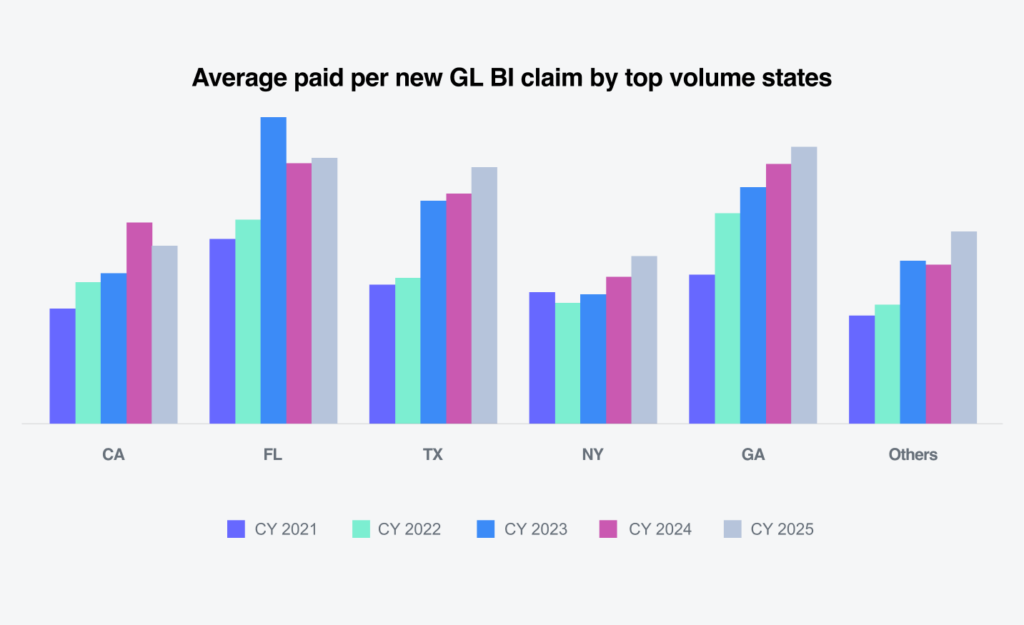
New York recorded the largest increase in average paid for new GL bodily injury claims, rising 14%, followed by Texas at 12% and Georgia at 7%. Georgia reported the highest average paid per new GL bodily injury claim. California experienced the largest decline, down 11%.
Florida’s tort reform enacted in 2023 appears to have materially reduced bodily injury paid severity; however, that benefit was partially offset in 2025 by continued medical inflation, social inflation and litigation severity. All remaining states collectively experienced an increase of 21%, consistent with trends observed in the largest states. Overall, the average annual percentage change for all states has been 14.1% since CY 2021.
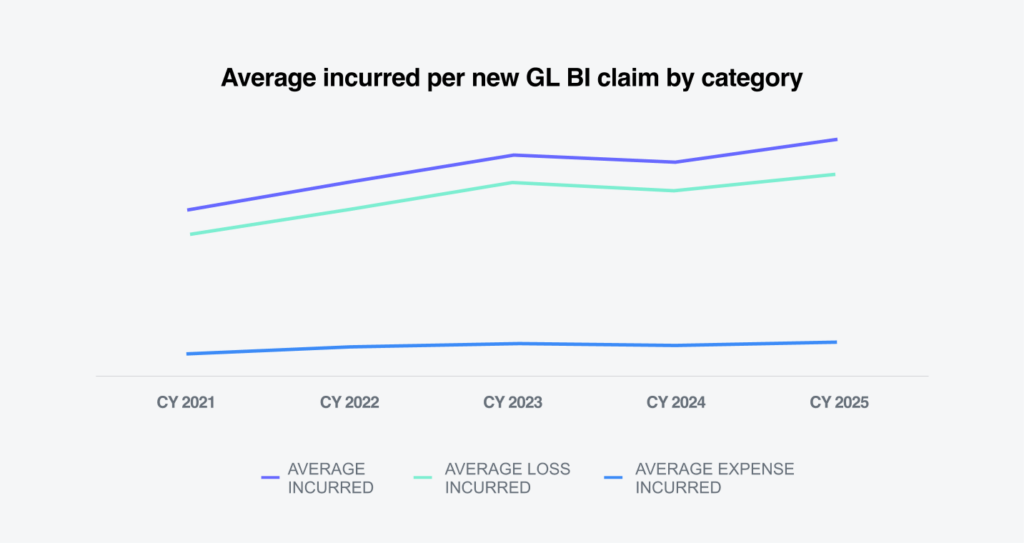
The average incurred loss for all new GL claims increased 6.2% in CY 2025 compared to CY 2024. The increase reflected growth in both average loss incurred, up 5.8%, and average expense incurred, up 8.5%.
The average incurred for new GL bodily injury claims increased 11% compared to CY 2024, after declining for the first time in CY 2024. Since CY 2021, the average annual percentage change for incurred new GL bodily injury claims has been 9.7%, more than three times the rate of inflation over the same period.
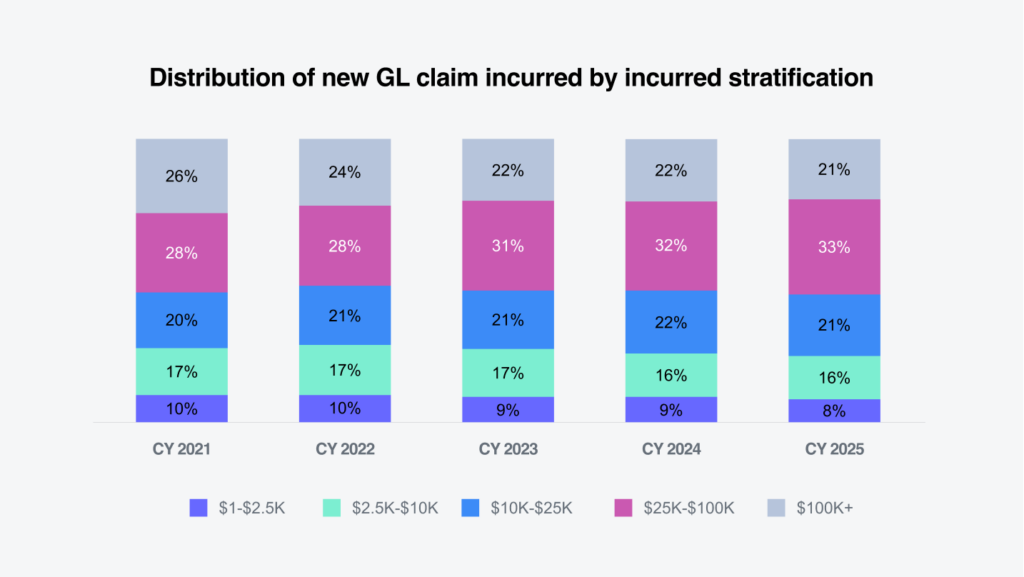
The $100,000+ tier of GL claims declined slightly, down 0.4% to 21.5% of total incurred losses, while representing 0.2% of new claim volume. The $25,000 to $100,000 tier increased to 33% of total incurred losses and accounted for 2% of new claim volume. Combined, claims of $25,000 and above represented 54% of total incurred losses for new GL claims.
Litigation
71%
GL litigated claims come in the door with attorney representation
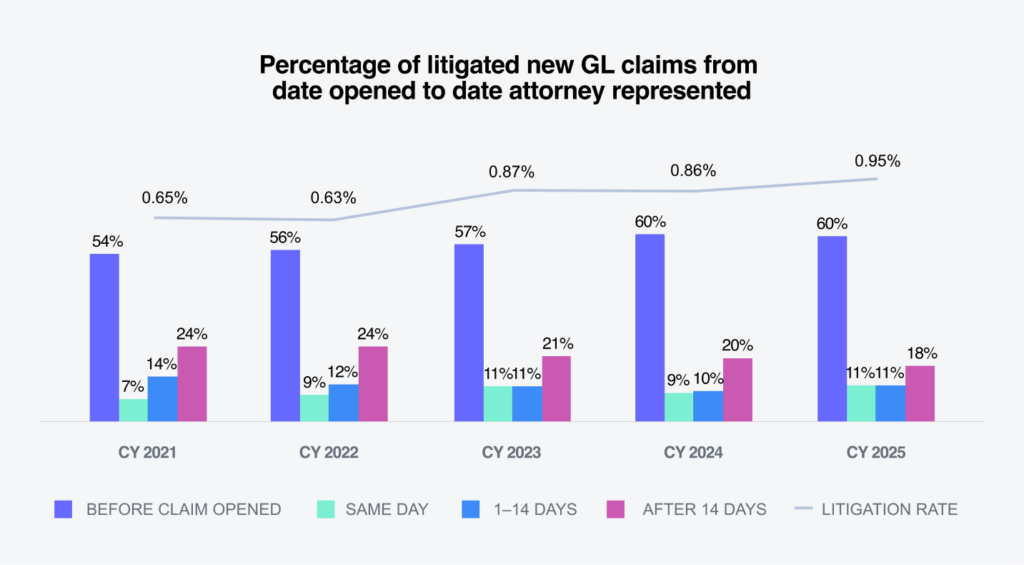
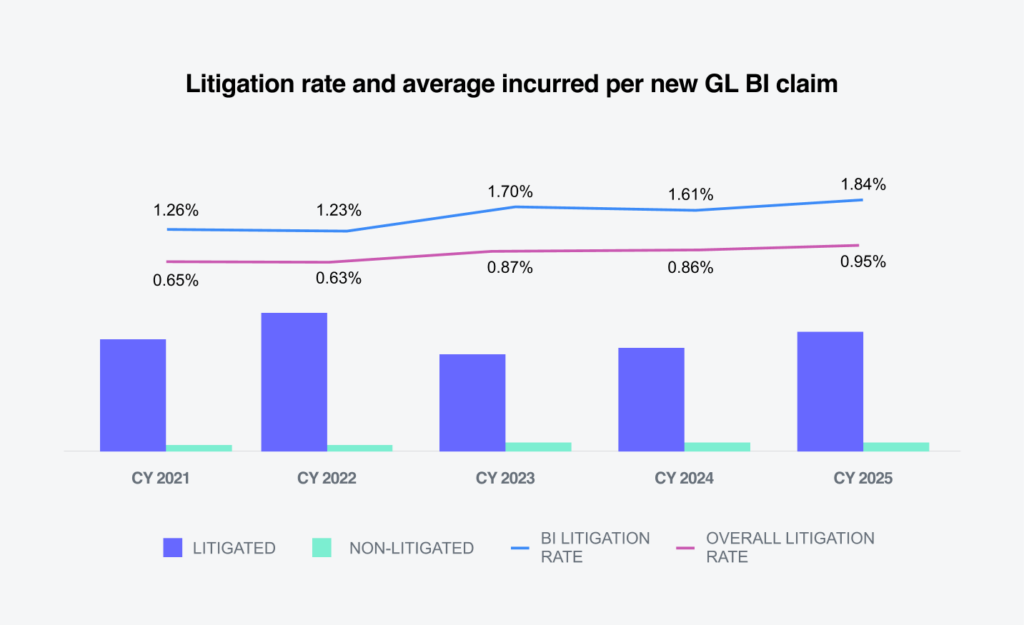
The litigation rate for new GL liability claims increased to 0.95%, up 0.09% from CY 2024. Data shows a continued trend toward more aggressive attorney involvement, with 71% of litigated new GL claims represented within 24 hours of claim opening and 83% represented within 14 days of reporting. Only 18% of litigated claims did not obtain attorney representation until more than 14 days after reporting.
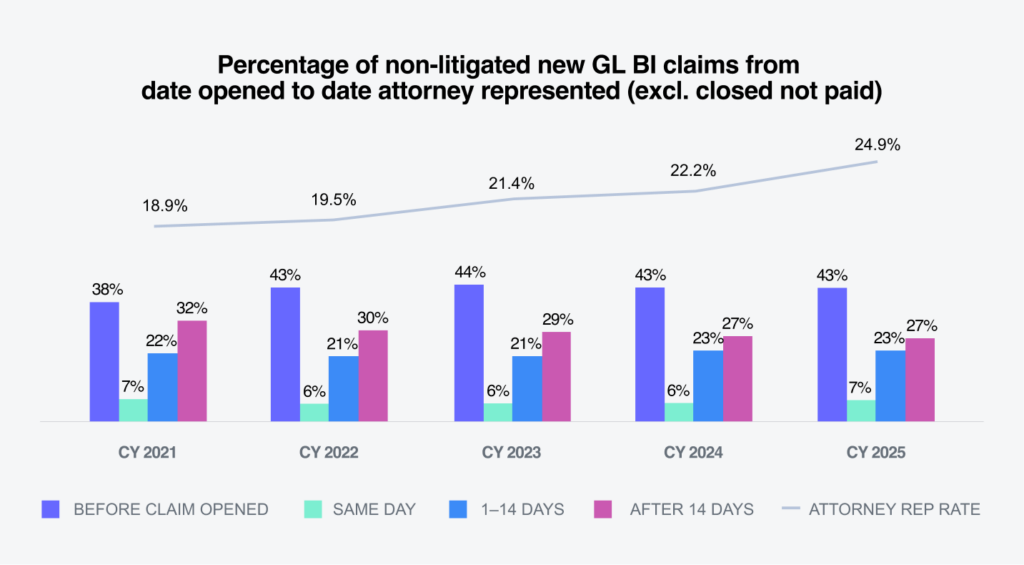
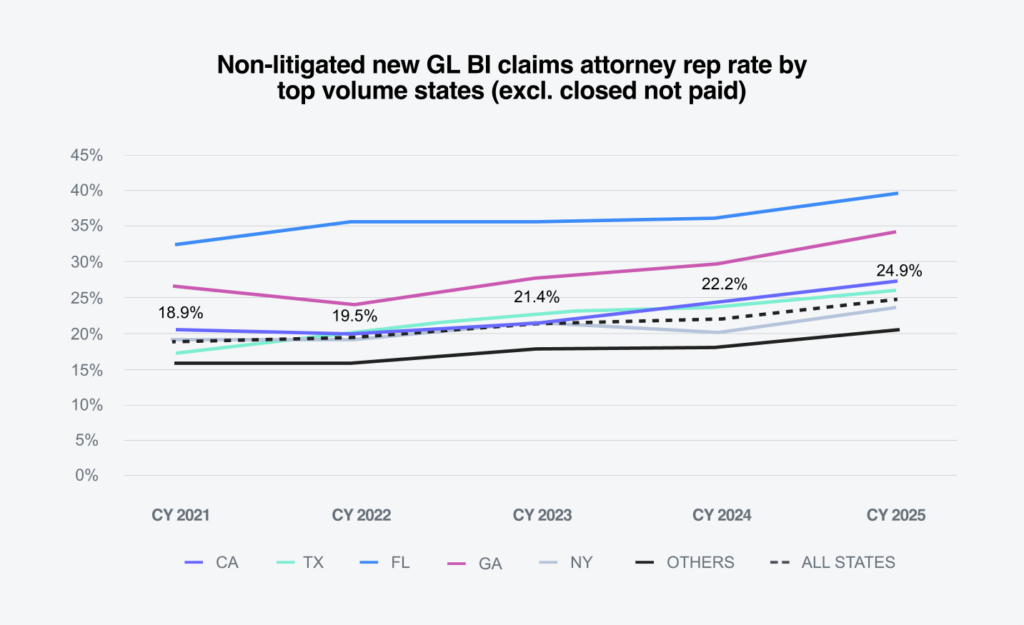
The attorney representation rate for non-litigated new GL bodily injury claims increased to 24.9%, up 2.7% from CY 2024. Among these claims, 50% had attorney representation within 24 hours of reporting, and 73% were represented within 14 days of reporting. Metrics for pending GL bodily injury claims show a similar rate of attorney representation.
Attorney representation rates for new non-litigated GL bodily injury claims were highest in Florida at 39.7%, followed by Georgia at 34.3%, California at 27.4% and Texas at 26.2%. However, all states continue to see increases in attorney representation rates.
The litigation rate for new GL bodily injury claims increased 0.23% to 1.84%, while the overall litigation rate rose 0.09% to 0.95%.
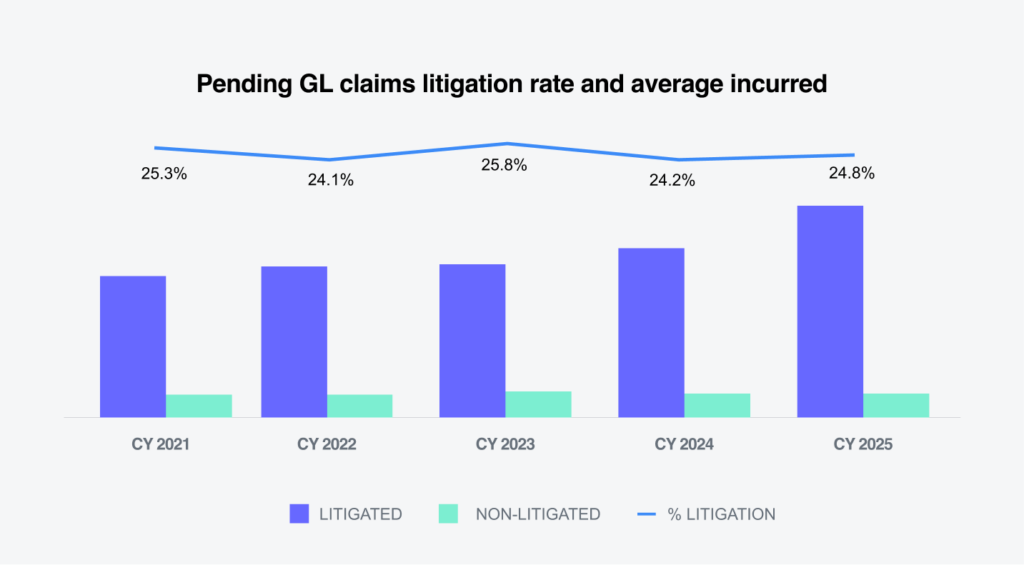
The litigation rate of pending GL claims increased slightly to 24.8%. The average incurred for pending litigated GL claims increased 25.7%, the highest in the last five years. Over the same five-year period, the average annual percentage change for litigated claims was 11.1%, compared with 3.3% for non-litigated claims, roughly in line with the rate of inflation.
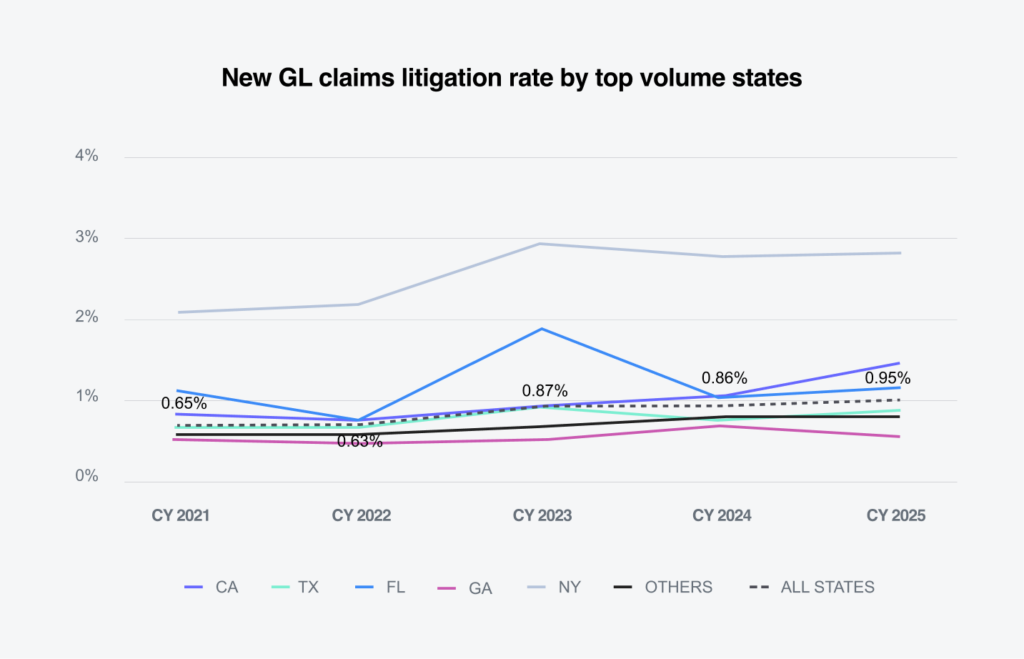
New York’s rate of newly litigated GL claims was 2.9 times the national average, at 2.77%. California and Florida also reported new GL litigated claim rates above the national average, at 1.43% and 1.09%, respectively.
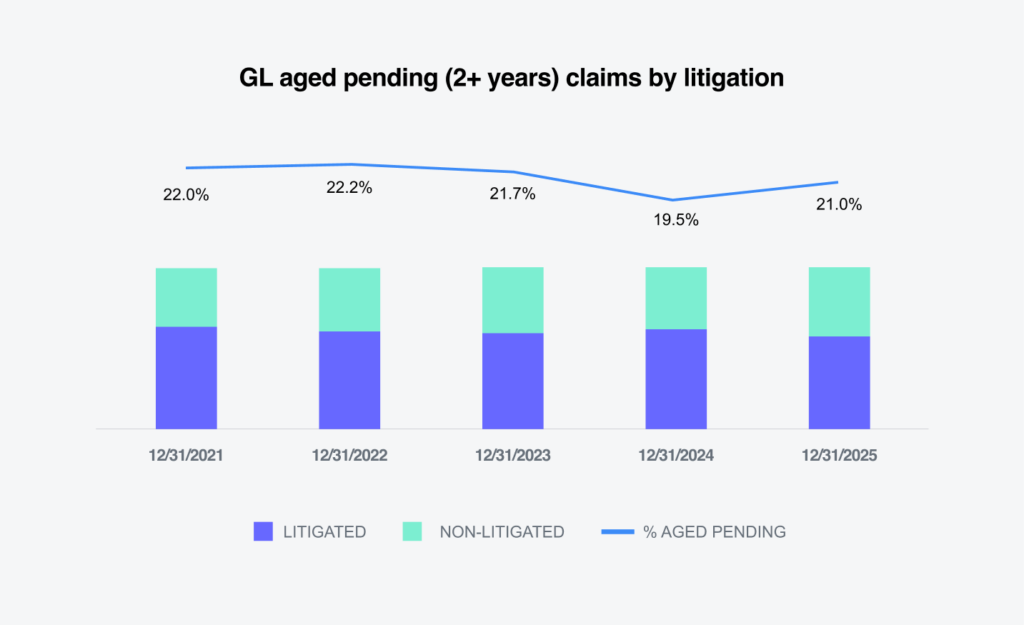
Litigated aged pending claims of two years or more increased 1.5% from CY 2024. The increase was driven by growth in both non-litigated pending claims, up 27%, and litigated pending claims, up 5.2%.
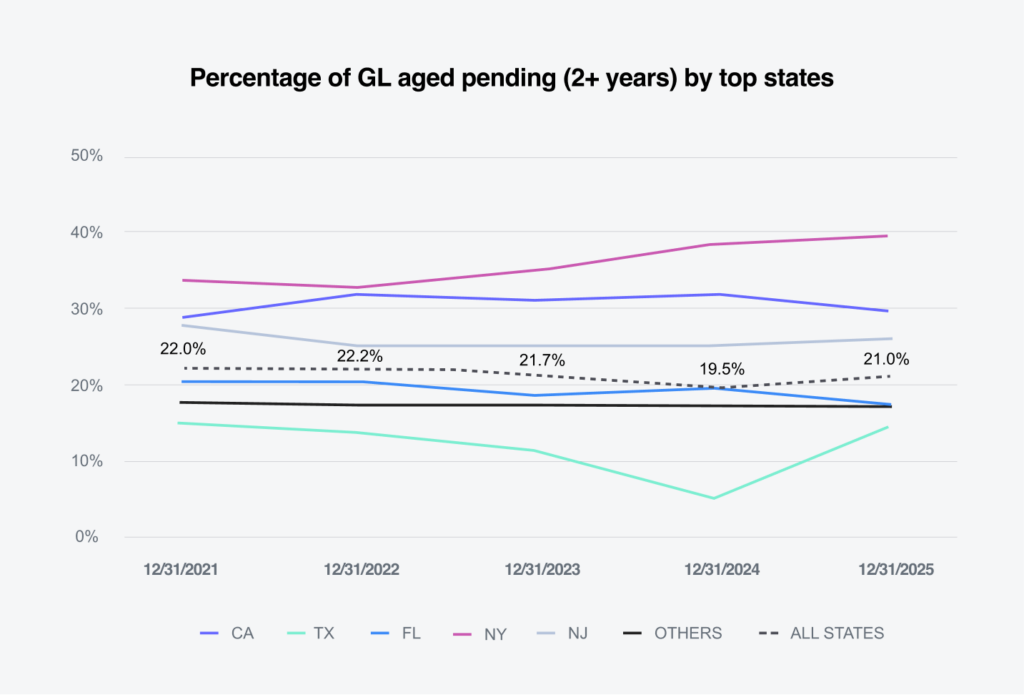
GL aged pending claims were most concentrated in New York, which recorded the highest percentage at 39.5%. California and New Jersey also exceeded the national average of 21%, at 29.9% and 26%, respectively.
Closures
Closure rates for new claims were relatively flat
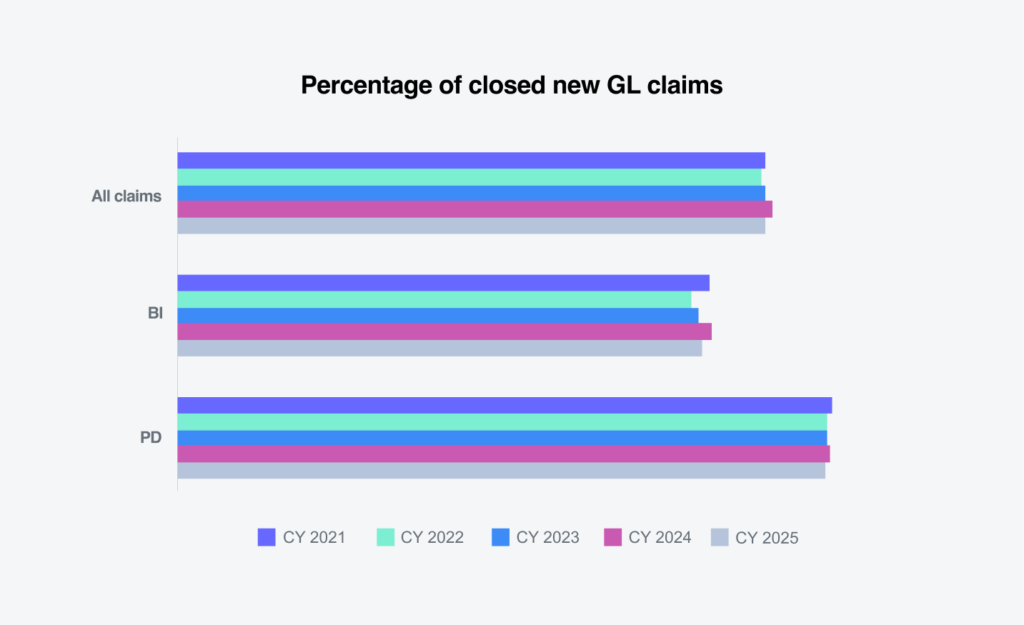
Overall liability closure rates for new claims in CY 2025 were relatively flat compared to CY 2024. Bodily injury closure rates declined slightly, while property damage closure rates remained largely unchanged.
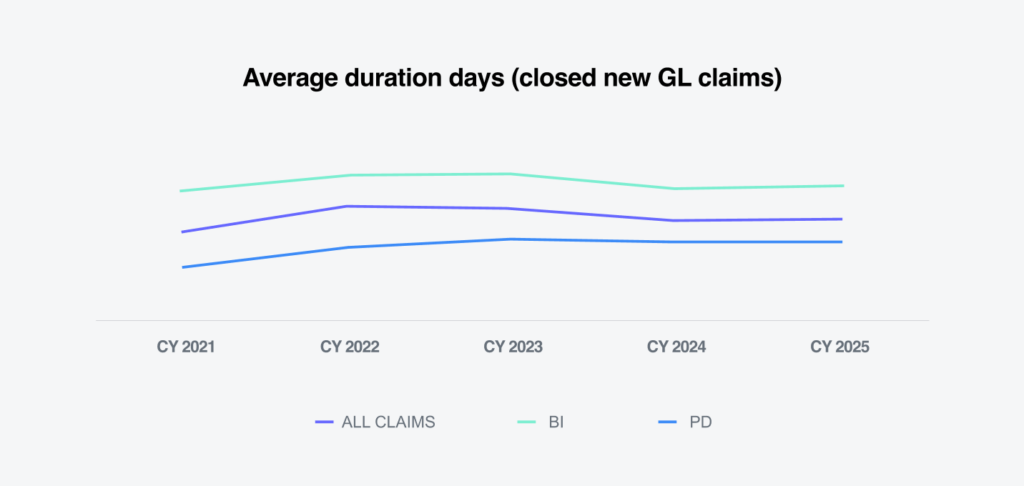
The average duration of all new GL claims remained unchanged. Both bodily injury and property damage claim durations were flat compared with CY 2024.
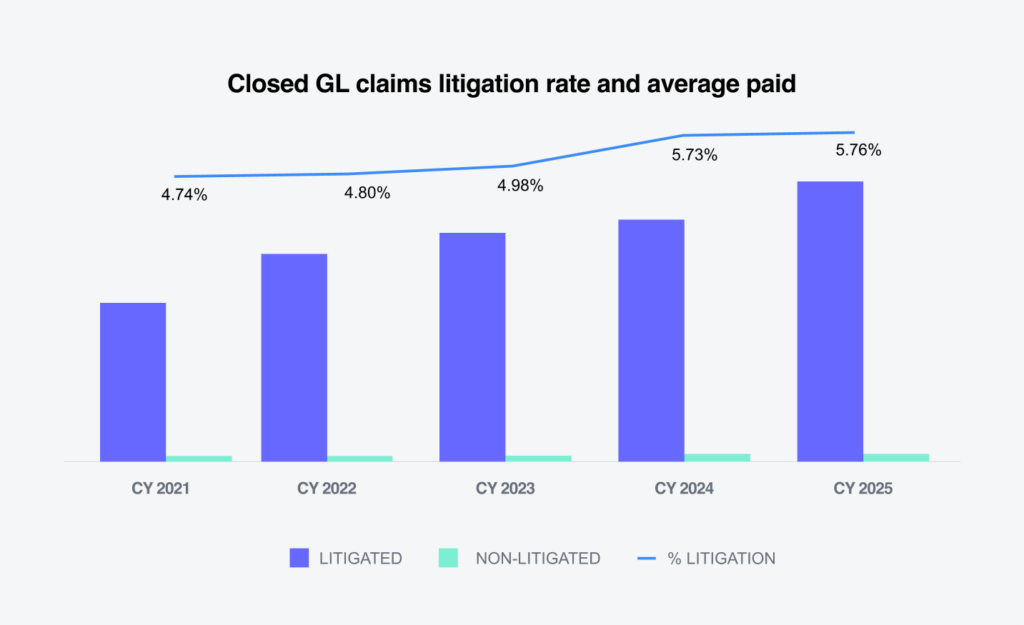
Litigated closed GL claims increased to 5.8% of all closed claims and accounted for 69.6% of total dollars paid on closed GL claims. The average paid for a litigated claim rose 15.9% in CY 2025, while the average paid on non-litigated closed GL claims declined 2.6%. On average, closed litigated GL claims cost 37.5 times more than closed non-litigated claims.
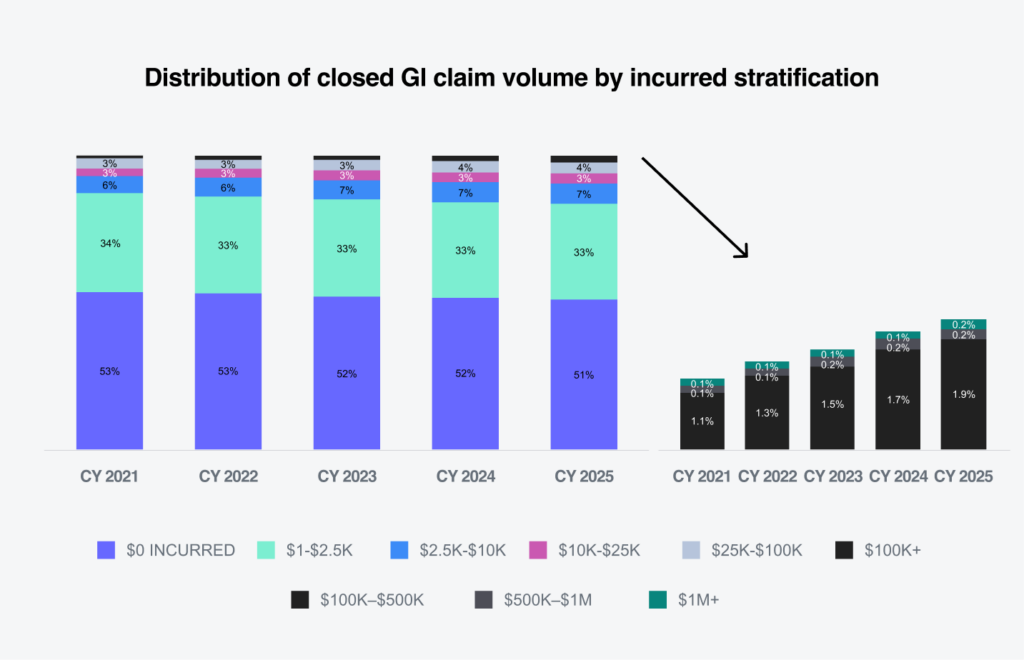
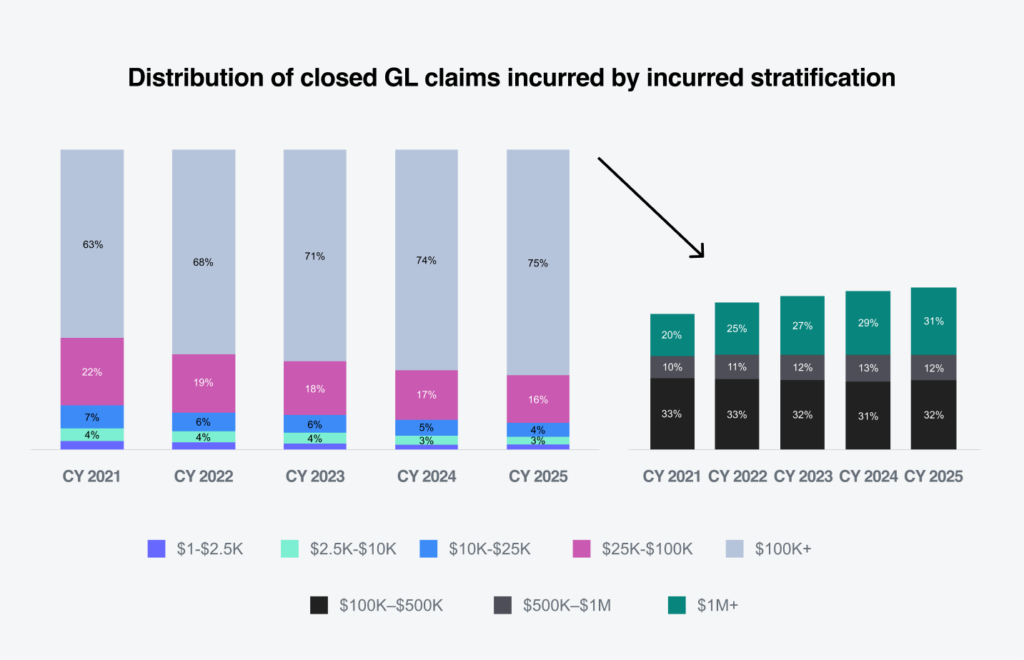
Higher-tier incurred groups have recorded increases in closed GL claim volume for five consecutive years. The largest tier, claims of $100,000 and above, accounted for 2.3% of all closed GL claims. However, within the overall closed-claim incurred stratification, this tier represented 75% of total incurred losses.
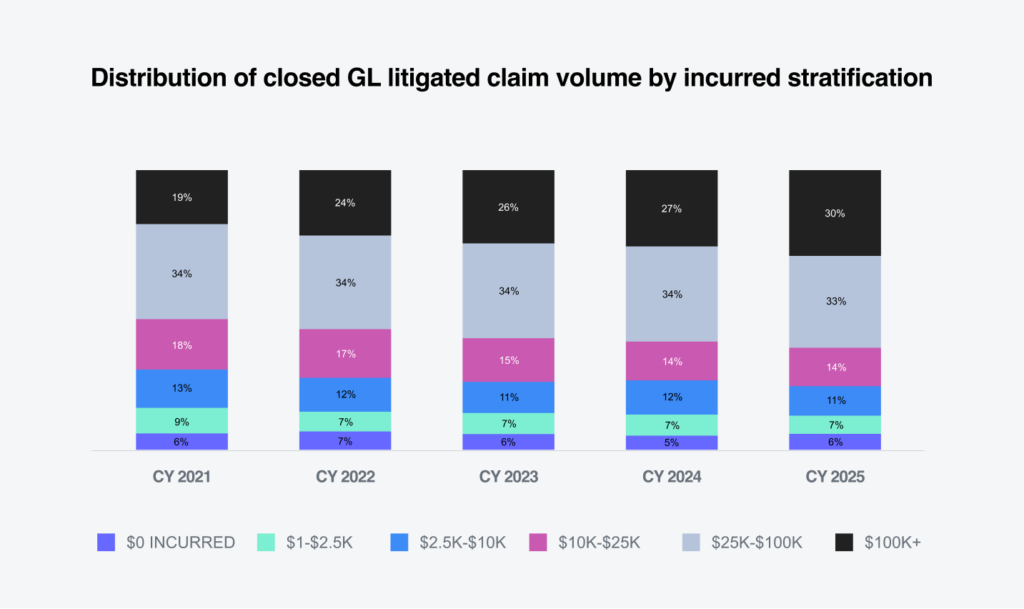
Among closed GL litigated claims, the highest-severity tier now represents 30% of closed litigated claim volume. This reflects an increase of 3% from CY 2024 and 11% from CY 2021. Overall, a growing share of claims is closing within higher incurred stratifications.
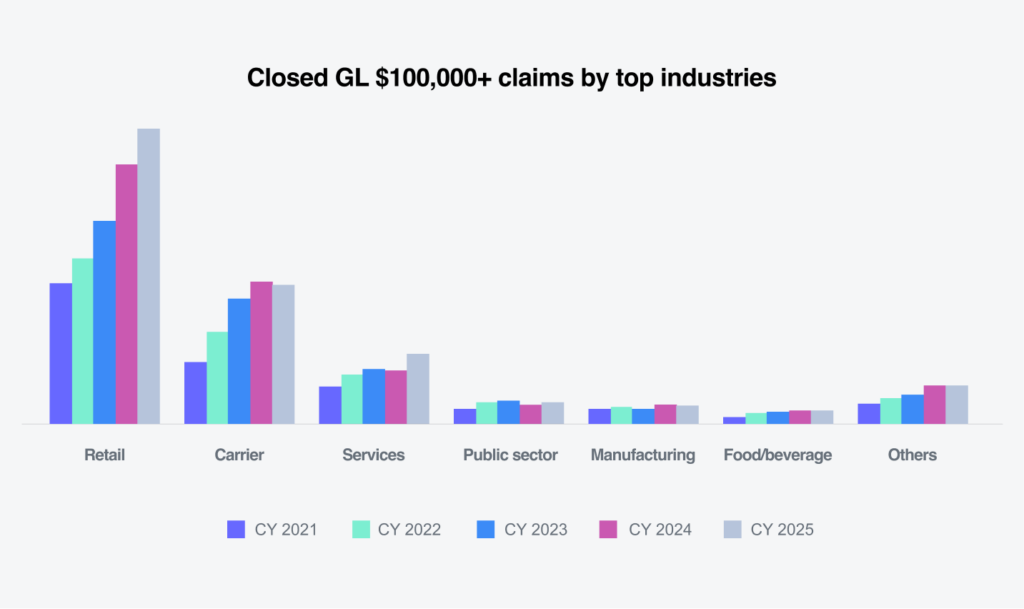
Increases in closed GL claims within the $100,000+ tier are affecting all industries. The services sector posted the largest percentage increase, up 29.7%, though it represents 11.7% of these claims. Overall, closed GL claims in the $100,000 and above tier increased 9.2%.
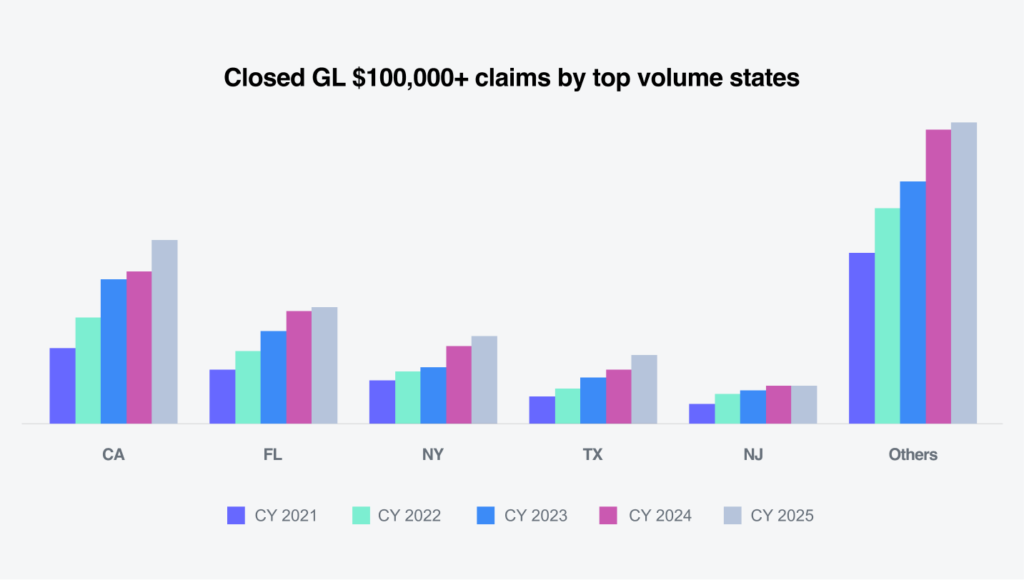
California, which accounts for 23.2% of closed GL claims in the $100,000 and above tier, recorded a 21% increase in CY 2025 compared with CY 2024. Texas posted the largest percentage increase, up 27%, though it represents only 8.6% of these claims nationwide. California, Florida and New York are the top volume states in the $100,000+ tier, accounting for 23.2%, 14.5% and 11% of claims, respectively.
Future considerations
Consistent with the overall industry, our liability claims data reflects:
01
Attorney representation continues to increase, with early engagement now a primary driver of claim severity. More than half of litigated claims had attorney representation in place within 24 hours of first notice.
02
Legal system abuse remains concentrated in high-severity claims, with a small share of litigated cases in the $100,000+ tier driving a disproportionate share of incurred and paid dollars, amplifying nuclear verdict® exposure.
03
Jurisdictional and venue dynamics are shifting, particularly in states experiencing outsized increases in litigated bodily injury severity.
04
Claims severity trends require tighter cross-functional collaboration, especially among claims, legal and analytics teams, to address patterns of early representation, repeat plaintiff firms and escalation pathways.
Liability claims are increasingly shaped by factors beyond claim handling alone. Litigation strategies, jury psychology, venue selection and early attorney engagement are converging to drive higher severity, longer claim life cycles and greater volatility. Addressing these pressures requires a deeper understanding of how and when claims escalate, and where intervention can still meaningfully influence outcomes.
Evolving industry concerns
01
Nuclear verdicts® remain a central concern in liability claims. They are driven by social inflation factors such as jury distrust of corporations, expanded views of corporate responsibility, third-party litigation funding and emotionally driven courtroom strategies. These verdicts influence not only trial outcomes but also future settlement expectations.
02
A disconnect is emerging between litigation frequency and severity. While litigation rates have stabilized or declined in some segments, the cost of litigated liability claims continues to rise disproportionately. This reflects a shift toward fewer but significantly more expensive lawsuits, often characterized by higher demands, longer litigation timelines and more aggressive plaintiff strategies.
03
Venue shopping is intensifying jurisdictional risk concentration. Plaintiff attorneys are increasingly strategic in selecting jurisdictions known for plaintiff-friendly judges, juries and procedural rules. Certain venues consistently produce higher verdicts, longer litigation durations and increased defense costs.
As outlined above, litigation and the environment in which it operates represent the single greatest influence on liability outcomes. The primary objective is to prevent litigation whenever possible through aggressive early investigation, strong advocacy, empathy, clear communication and early resolution efforts. When litigation does occur, the focus shifts to disciplined oversight, cost control and accountability, supported by structured workflows designed to improve outcomes across both litigated and non-litigated claims.

Early claim identification is a critical component of this approach. The use of advanced technology, including artificial intelligence, predictive modeling and data mining, enables earlier assessment of potential exposure and litigation propensity at the individual claim level. The depth and quality of available data are essential to minimize false positives and ensure resources are directed appropriately. The goal is to identify the small subset of claims that drives a disproportionate share of total cost and to apply targeted workflows that promote the best possible outcomes. For these high-exposure claims, traditional workflows focused primarily on cost containment are no longer sufficient and must be replaced with outcome-focused strategies. These workflows emphasize enhanced investigation, increased supervisory involvement, expert roundtables and the strategic use of external resources.
High-exposure claims should not be managed in isolation. Greater collaboration with experienced industry professionals brings strategic judgment, pattern recognition and institutional perspective across industries, jurisdictions and plaintiff tactics. On complex claims, outcomes are driven by strategy rather than activity alone. Organizations that deliberately align deep internal claims expertise with defense counsel proven in high-severity litigation gain a meaningful competitive advantage. Together, these tools and processes promote consistency, strengthen decision-making, and ultimately reduce severity and total cost of risk.
Conclusions
The data in this report underscores a GL environment increasingly shaped not by claim frequency alone, but by accelerating severity, legal complexity and volatility.
While overall claim volume continues to rise at a modest pace, loss costs are increasing far more rapidly, with average paid and incurred values significantly outpacing inflation. This divergence reflects a market in which a relatively small share of high-severity claims drives a disproportionate share of loss dollars, reinforcing that severity, rather than frequency, is now the primary risk management challenge in GL programs.
Social inflation and the expanding influence of nuclear verdicts® remain central contributors to this trend. The concentration of incurred and paid dollars in claims exceeding $25,000, and particularly those above $100,000, illustrates how legal system dynamics, jury sentiment and venue behavior magnify exposure far beyond traditional loss drivers. These high-severity outcomes are no longer isolated events; they are increasingly systemic, affecting multiple industries and jurisdictions, and adding uncertainty to reserving, pricing and long-term cost projections.
Attorney representation patterns further compound these pressures. Legal involvement is occurring earlier and more frequently, with most litigated claims now represented within 24 hours of first notice and representation rates rising even among non-litigated bodily injury claims. Early attorney engagement limits opportunities for rapid investigation, early resolution and controlled claim direction, increasing the likelihood of escalation into prolonged and costly disputes. As a result, attorney involvement itself has emerged as one of the most reliable early indicators of claim severity.
For companies and risk managers, these trends demand a strategic shift. Traditional claims management approaches focused primarily on closure speed and expense control are no longer sufficient. Instead, organizations must prioritize early severity identification, rapid escalation protocols for attorney-involved claims and venue-aware defense strategies. Investment in analytics, predictive modeling and tighter collaboration between claims, legal and risk teams are critical to identifying high-risk claims sooner and intervening before positions harden and costs escalate.
Ultimately, managing GL risk in today’s environment requires recognizing that external forces such as social inflation, litigation funding and evolving jury dynamics are reshaping loss outcomes. Organizations that adapt by emphasizing early engagement, disciplined decision-making and proactive litigation management will be better positioned to reduce volatility, protect balance sheets and navigate an increasingly complex liability landscape.
2025 YEAR-END