

2025 YEAR-END
Disability and leave of absence

Report Objectives
This report aims to summarize the present metrics for our disability programs, assess the landscape of disability claim administration and litigation, and benchmark our patterns against comparable industry research.
data parameters
Our practice team uses JURIS and TAMS claims data to perform comparative analyses informed by their expertise and analytics. The data in this report is based on the calendar year, January through December, for each reporting year.
Certain client data is excluded from book of business metrics to avoid overrepresentation of a single client.
Key observations
Short-term disability (STD) trends remained consistent by age, while claim share declined among employees under 25 and continued to rise among those 55 and older. Mental and substance-related conditions remained the leading non-pregnancy diagnoses across nearly all age groups, with anxiety-related claims continuing to increase year over year. Stand-alone leave volumes remained largely stable, with employee medical leave accounting for the majority of cases and modest growth in approved leave durations across both continuous and intermittent leave types.
Short-term disability trends around age, length of service and incident rates
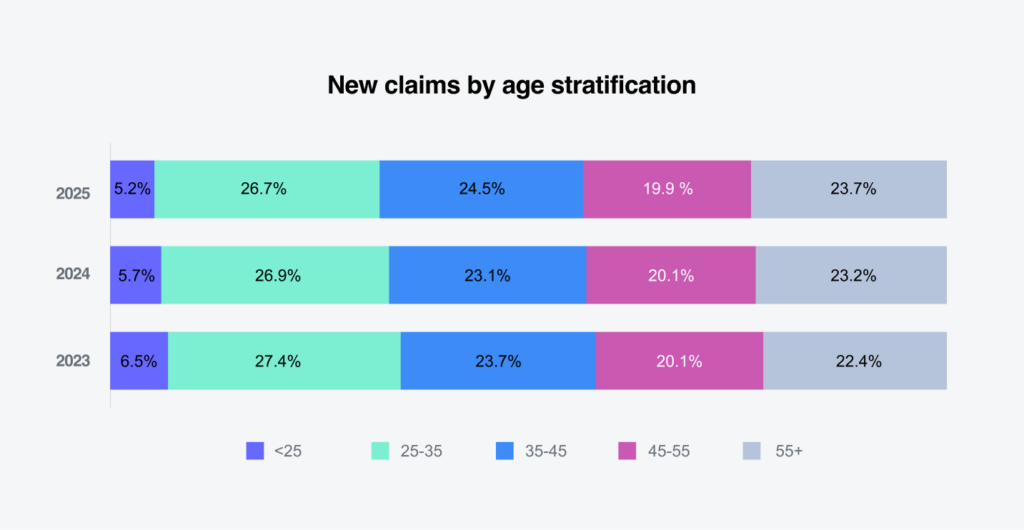
26.7%
largest share of new claims represented by the 25–35 age group, followed by the 35–45 age group (24.5%).
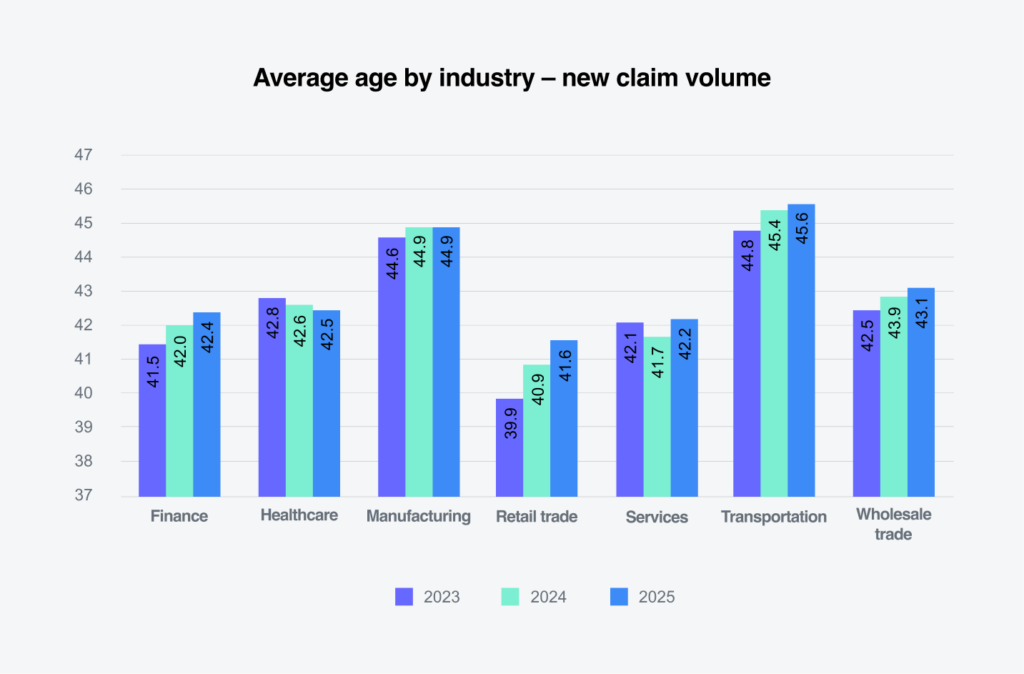
These shifts align with national workforce movements reported by the U.S. Census Bureau and the Annual Disability Statistics Compendium (2025), which show decreasing disability utilization among younger workers and rising claims among mid‑career and older populations due to musculoskeletal, mental health and caregiving‑related conditions. This concentration in the 25–45 age range signals where employers may see continued pressure on claim volume, particularly in industries with aging workforces such as manufacturing and transportation.
1.3%
decrease in claims from claimants aged <25 to 5.2% (down from 6.5%).
The 55+ group increased steadily (22.4% in 2023 to 23.7% in 2025).
PREGNANCY
remains the leading diagnosis group for new short-term disability claims, followed by mental/substance.
Leading diagnostic groups
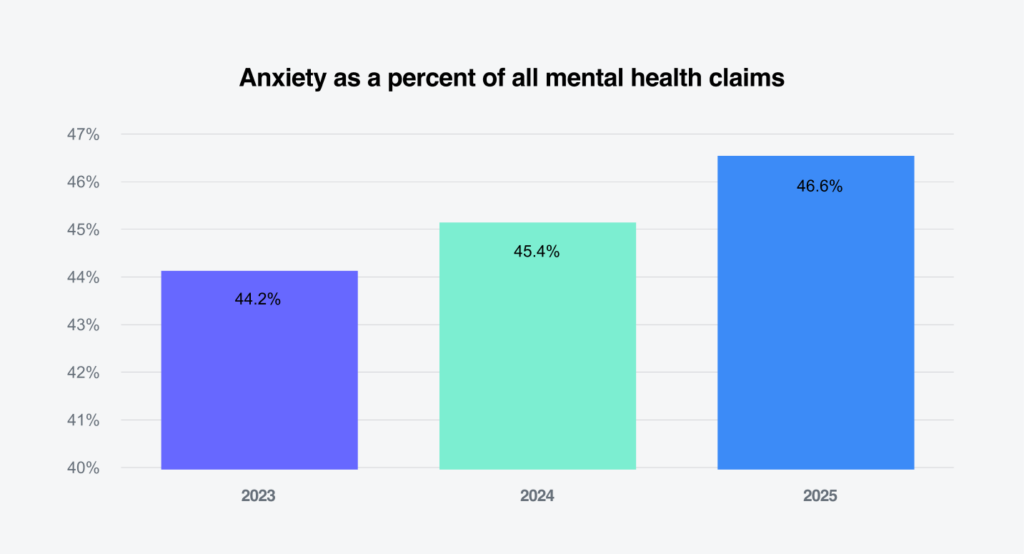
Mental/substance continues as the leading non‑pregnancy diagnosis across nearly all age ranges. Anxiety‑related conditions accounted for 46.6% of all mental health claims (up from 45.4% in 2024 and 44.2% in 2023), underscoring sustained behavioral health demand across industries.
International Classification of Diseases (ICD) patterns also vary meaningfully by age: pregnancy and mental health dominate for the 25–45 age groups, while musculoskeletal and back/spine become increasingly prevalent for employees ages 45–55 and especially 55+.
These differences have operational implications — industries with older workforces (e.g. Manufacturing, Health Care, Transportation) will continue to see higher durations linked to physical health conditions, while industries with younger, professional or hybrid‑work populations (e.g., Finance, Services) may see a heavier mix.
Claim durations and denials
Year‑end STD closed claims increased 1.3%, and average duration rose 2.7% (59.1 days). Duration growth was most notable in mental/substance diagnoses (up to 72.6 days), with depression and anxiety durations increasing 2% and 1.7% respectively.
The 35–45 and 45–55 age groups drove the largest age‑based increases in duration, reflecting the combined influence of pregnancy, mental health and musculoskeletal ICD categories. Length of service (LOS) patterns remained stable year over year, with the 20+ age group showing the highest growth in duration (from 67.7 to 69.8 days), reinforcing the prolonged recovery periods associated with long‑tenured employees in physically demanding or high‑stress industries.
Leave volumes and types
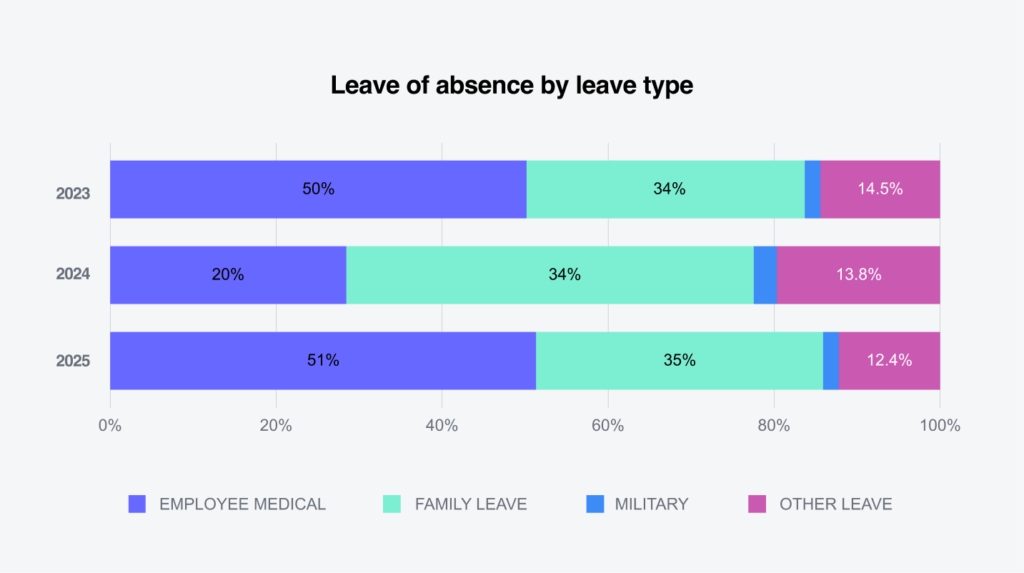
At year‑end, stand-alone leave volumes remained stable, increasing by 1.7%–1.8% compared to the prior year. Employee medical leave continued to represent the largest portion of all new stand-alone leave cases and grew by 2.3%, while family leave declined slightly (–0.6%). Together, these categories continue to account for most of all stand-alone leave activity, with minimal shifts in overall distribution.
Age‑based patterns remained consistent with prior years. The 25–35 age group continued to drive the largest share of new leave cases, though its proportion decreased by 2.8%, while the 55+ age group increased by 5.2%, reflecting an aging workforce and higher medical‑care utilization among older employees.
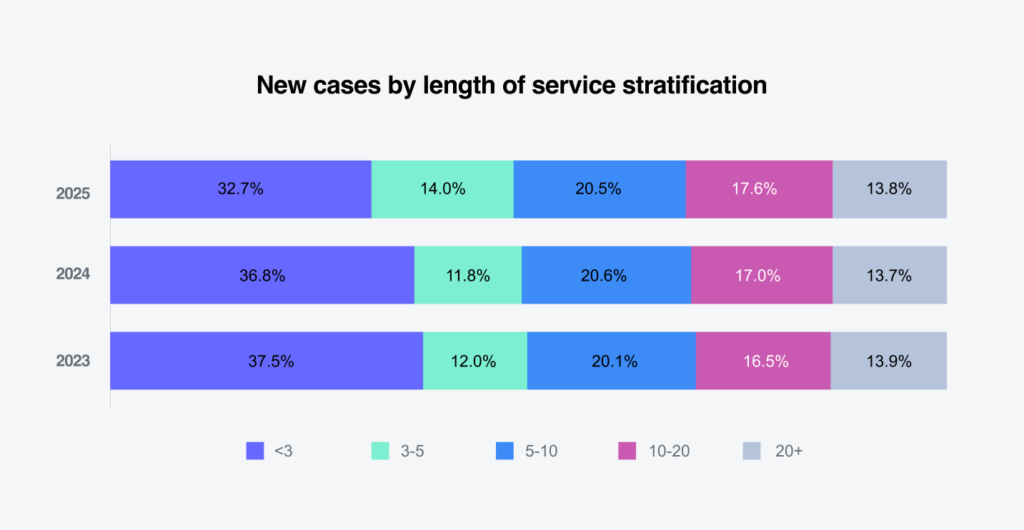
LOS trends also remained stable. Employees with less than three years of service remained the largest LOS segment but declined by 7.9%, while employees with 10–20 years of tenure saw a 4.6% increase, indicating higher leave utilization among mid‑tenure workers. By industry, healthcare and services experienced moderate year‑end increases in leave volume, while other sectors remained flat or declined slightly — consistent with differing labor force sizes and operational demands across industries.
Approval rates and leave durations
Year‑end approved leave durations increased for both continuous and intermittent leave types. Continuous leave duration increased by 3.1%, rising from 32 to 32.9 days, while intermittent leave increased by 3.2%, moving from 13.5 to 14 days. These increases reflect modest year over year growth in the length of approved leave and a continued shift toward longer recovery or caregiving periods.
Age‑specific patterns remained consistent: employees 55+ continued to experience the longest durations, with continuous leave increasing from 39.4 to 41 days and intermittent leave from 10.8 to 11.1 days. These age‑related differences align with broader industry and national findings on rising chronic condition prevalence and caregiver responsibilities among older workers.

Download a summary slide with these key observations.
REPORT CONTENTS
Short-term disability
Claim volumes remained steady
Year‑end short-term disability (STD) new claim volumes remained steady across quarters, following the same general pattern observed over the past three years.
Quarterly volumes fluctuated within a narrow range from 2023 through 2025, with no significant spikes or declines across the 12‑quarter period, reflecting a stable new claim environment. In 2025, volumes trended slightly higher in the first half of the year before leveling off in the third and fourth quarters, consistent with historical patterns and variability seen in both 2023 and 2024. The year‑end view confirms that STD new claim volume remains stable and aligned with expected book‑level norms, without notable deviation from prior‑year trends.
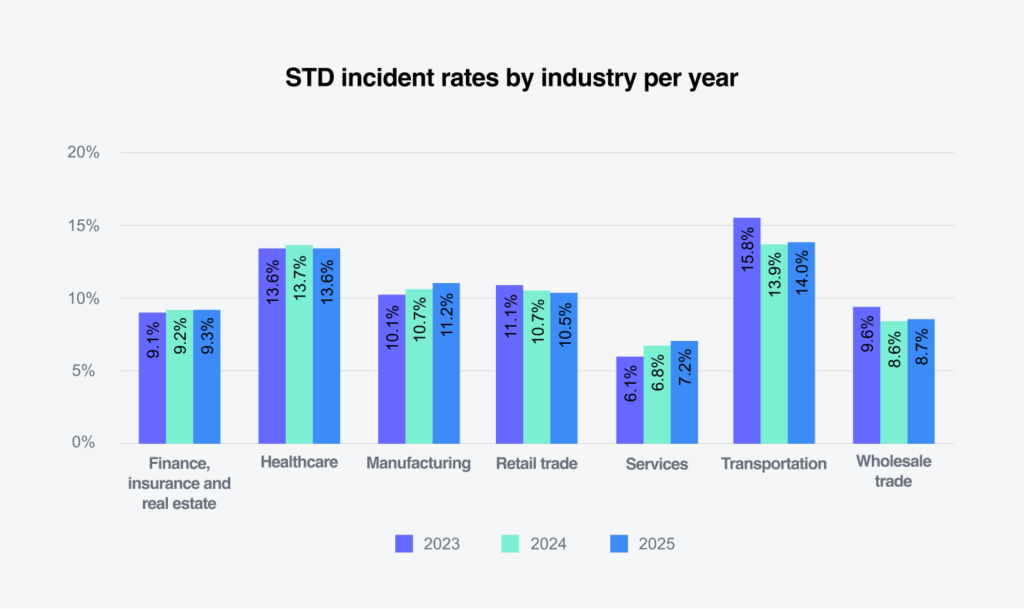
Incident rates remain flat across all industries in 2025, with modest increases limited to the manufacturing and services sectors. Overall stability suggests STD trends have returned to pre-COVID levels, with claim volumes and incident rates expected to remain consistent through 2026.
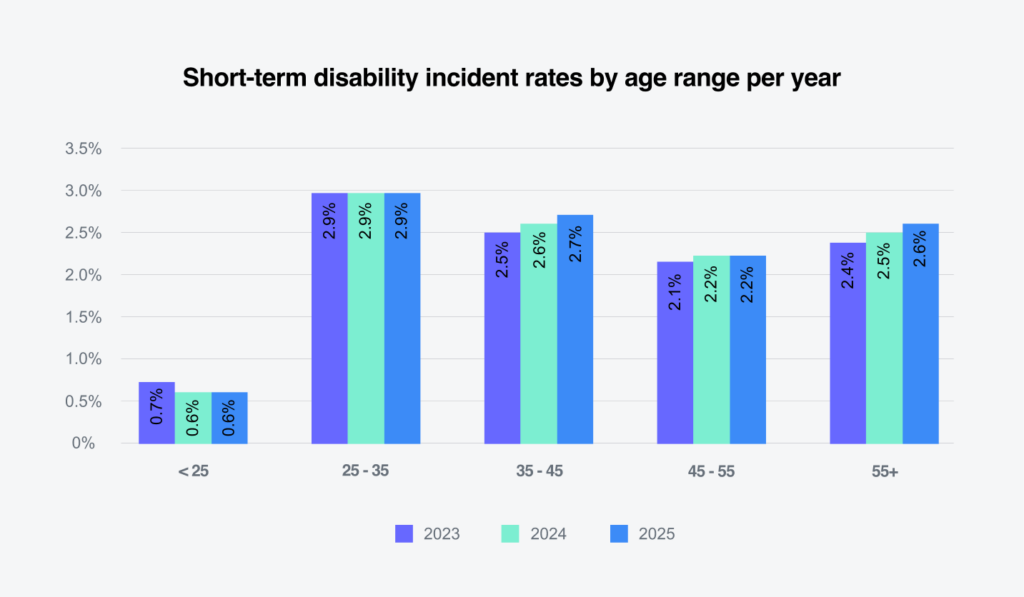
Incident rates by age range remained stable at year’s end, with only minor shifts across groups. Employees under 25 held steady at 0.6%, while those ages 25–35 remained at 2.9%, continuing to reflect lower STD utilization among younger workers. The 35–45 age group was the only cohort to show a year-over-year increase, rising slightly from 2.6% in 2024 to 2.7% in 2025.
Patterns among older remaining age groups were consistent with prior years. The 45–55 population remained stable at 2.2%, while employees 55 and older increased modestly to 2.6%, aligning with their growing share of new STD claim volume in 2025. These trends mirror the overall age distribution of new claims, with ages 25–35 remaining the largest group, followed by ages 35–45, which continues to account for an increasing proportion of new STD claims.
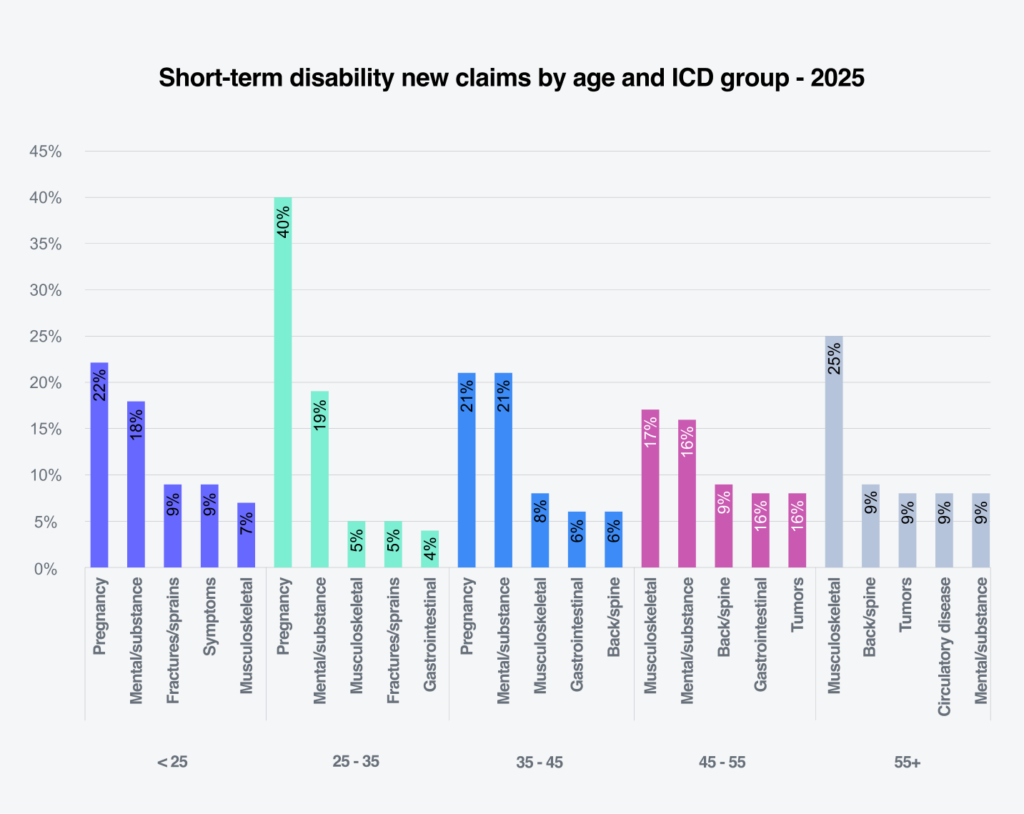
Diagnostic patterns across age groups remained consistent. Pregnancy is the top diagnosis for employees under 25, ages 25–35 and ages 35–45, accounting for 22%, 19% and 21% of new STD claims respectively. For older groups, musculoskeletal conditions emerged as the primary driver, representing 17% of claims for ages 45–55 group and 25% for those 55 and older, reflecting expected increase in chronic and physical health‑related conditions with age.
Mental/substance diagnoses remain the second‑largest category across nearly all age groups, accounting for 18% of new claims under 25, 19% among ages 25–35, 21% among ages 35–45 and 16% among ages 45–55. Anxiety continued to increase as a share of total mental health claims, reaching 46.6% in 2025, up from 45.4% in 2024 and 44.2% in 2023. These patterns align with higher mental health utilization among mid career employees, particularly those ages 35–45 and 45–55, where mental health consistently ranks among the top diagnostic groups.
Age‑related trends across ICD categories reflect the broader composition of the STD population. Employees ages 25–35 and 35–45 remained the largest sources of new claims, with younger workers showing higher proportions of pregnancy and mental health–related claims, while older age groups exhibited greater representation in musculoskeletal, circulatory and chronic condition–related diagnoses.
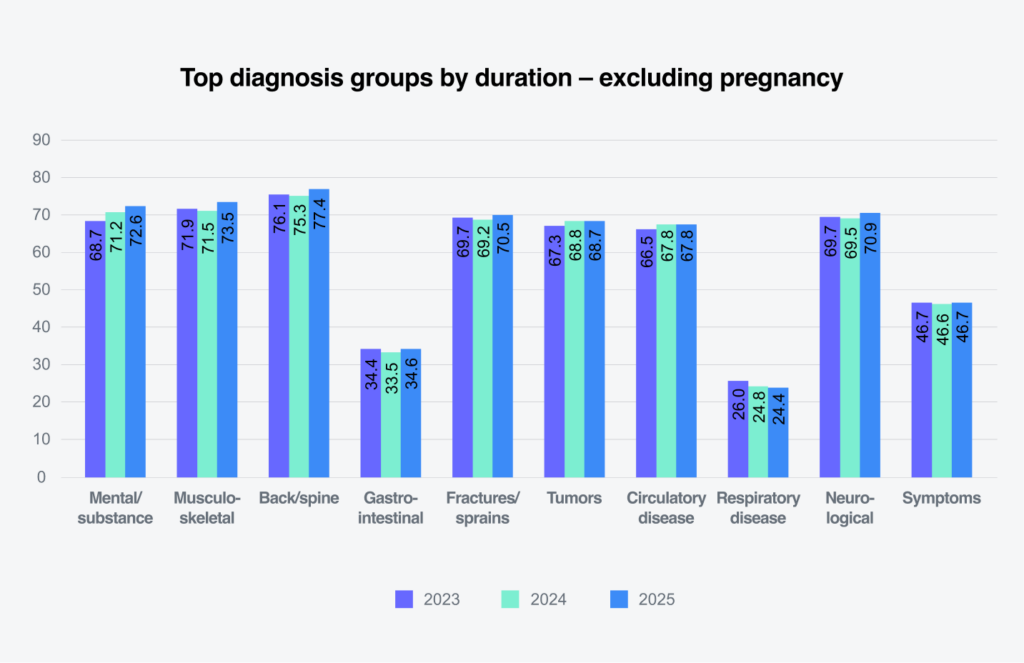
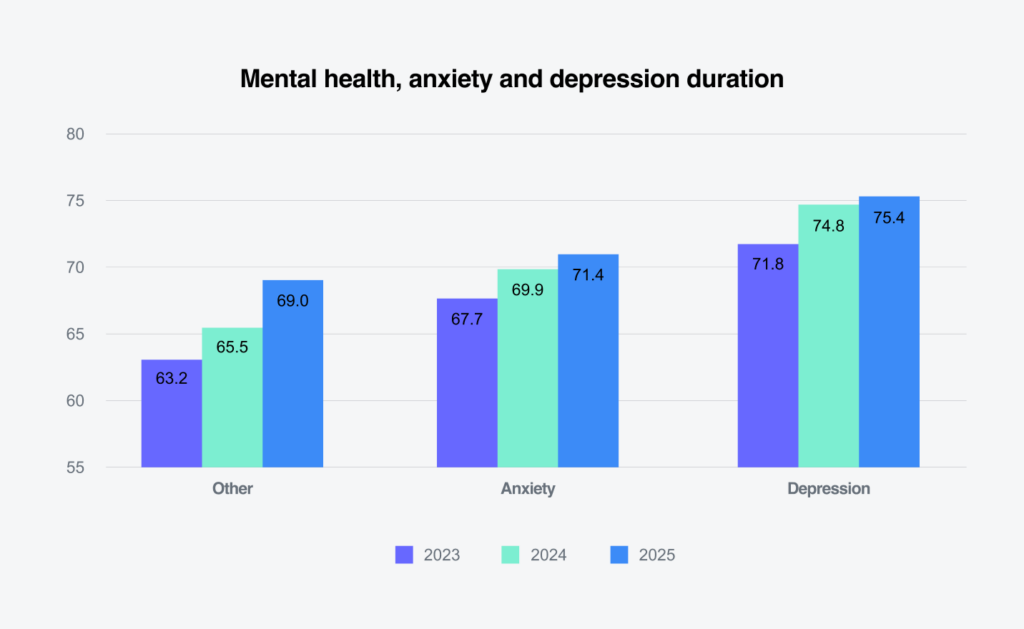
In closed claims excluding pregnancy, mental/substance remained the leading diagnosis by duration, increasing from 71.2 days in 2024 to 72.6 days in 2025, up from 68.7 days in 2023. Back and spine, musculoskeletal and circulatory disease categories also recorded modest increases in approved days.
Mental health‑specific durations increased as well. Anxiety-related claims increased from 69.9 to 71.4 days, while depression increased from 74.8 to 75.4 days, indicating slightly longer recovery periods year over year. These increases align with the overall rise in total approved days and underscore the continued impact of behavioral health conditions on STD duration across the book of business.
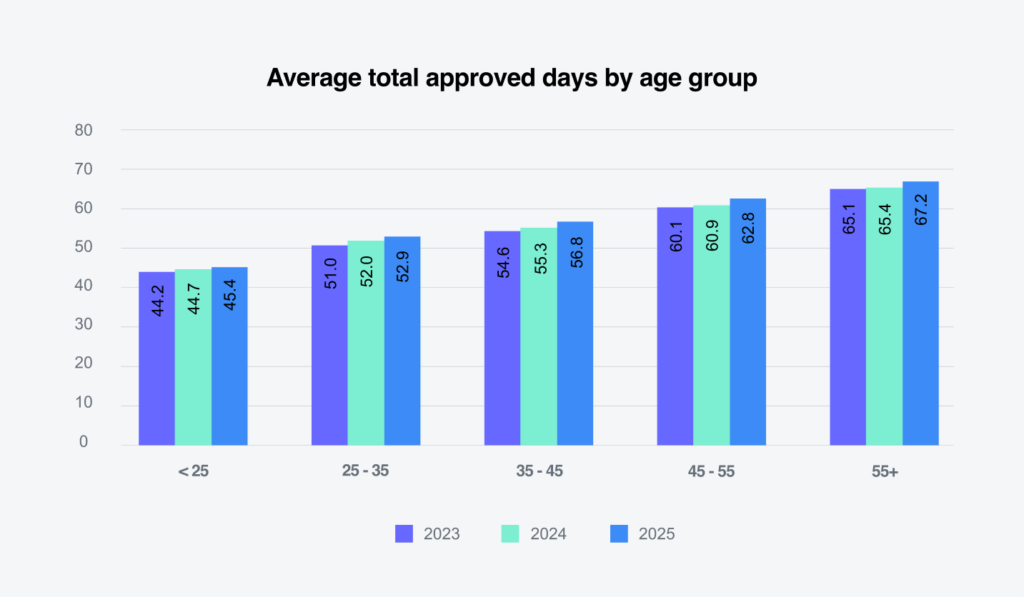
Average STD duration increased across all age groups. Employees ages 35–45 and 45–55 experienced the largest increases, with average durations rising from 55.3 to 56.8 days and from 60.9 to 62.8 days respectively.
Younger employees under 25 and ages 25–35 saw smaller increases, while employees 55 and older continued to have the longest durations overall, increasing from 65.4 to 67.2 days. These patterns align with the diagnostic mix by age, with pregnancy and mental health driving durations among ages 35–45 and musculoskeletal and mental health conditions predominating among ages 45-55 and 55 and older.
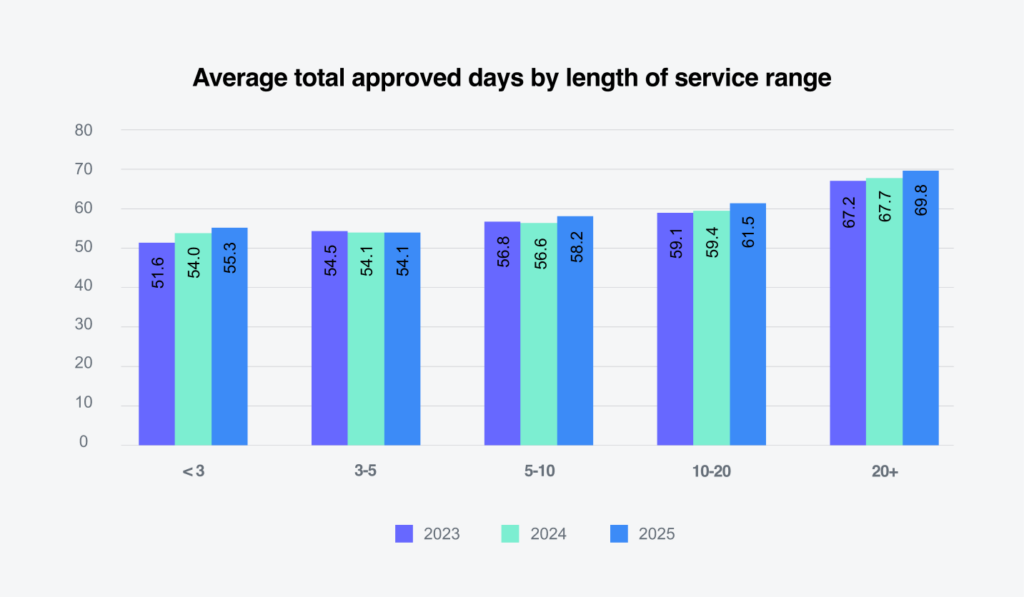
Duration by length of service remained largely stable. Most tenure groups recorded only modest year over year increases, including employees with less than three years of service, whose average duration rose from 54.0 to 55.3 days, those with five to 10 years, which increased from 56.6 to 58.2 days, and those with 10 to 20 years, which rose from 59.4 to 61.5 days. Employees with 20 or more years of service experienced the largest increase, from 67.7 to 69.8 days, while the three-to-five year group remained unchanged at 54.1 days, reflecting continued stability induration patterns across tenure levels.
Leave of absence
The trends observed at mid-year 2025 continued through the remainder of the year, with both employee medical and family leave increasing compared with 2024 and 2023. Other leave types declined by 1.4% year over year, continuing the downward trend in stand-alone leave that began in 2023.


The midyear increases seen in the 25–35 and 55+ age groups held steady throughout 2025. Leaves among claimants with less than three years of service fell 4.1%, offset by a 3.8% year over year increase among those with three to five years of service. This shift appears to be driven by two factors. First, the workforce realignment that began in 2022 has stabilized, with more job changers now reaching three or more years of tenure with their current employers. Second, ongoing economic uncertainty and the approach of the 2026 midterm elections may be discouraging job mobility. Large layoffs in sectors such as transportation and retail have also prompted some employees to reconsider changing jobs.
Company-paid leaves
55.6 DAYS
average duration of paid parental leave
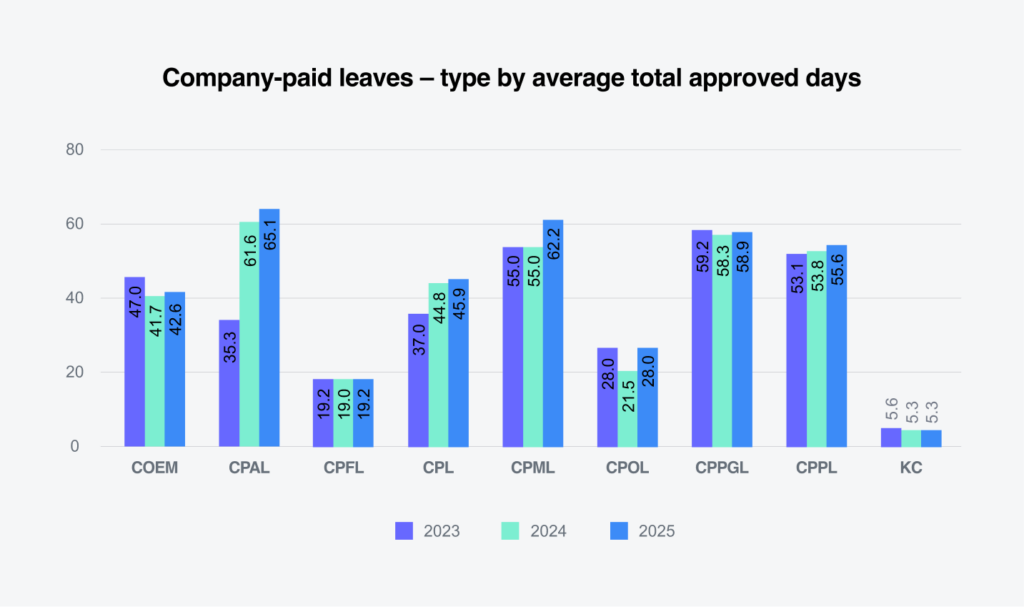
When comparing the duration of company-paid benefits, paid parental leave had the highest usage, with an average duration of 55.6 days, or about eight weeks.
Company-paid military leave, which accounts for less than 3% of all company leaves, increased in duration from 55 days in 2024 to 62.2 days in 2025. The increase is attributed to severe weather events and National Guard activations for deployments in several states and cities. Company-paid adoption leaves also recorded an increase in duration of nearly 4%. Based on the data, adoption leave continues to be administered under the company’s paid parental leave benefit.
Long-term disability
+0.6%
increase in aged 55+ claimants transitioning to long-term disability
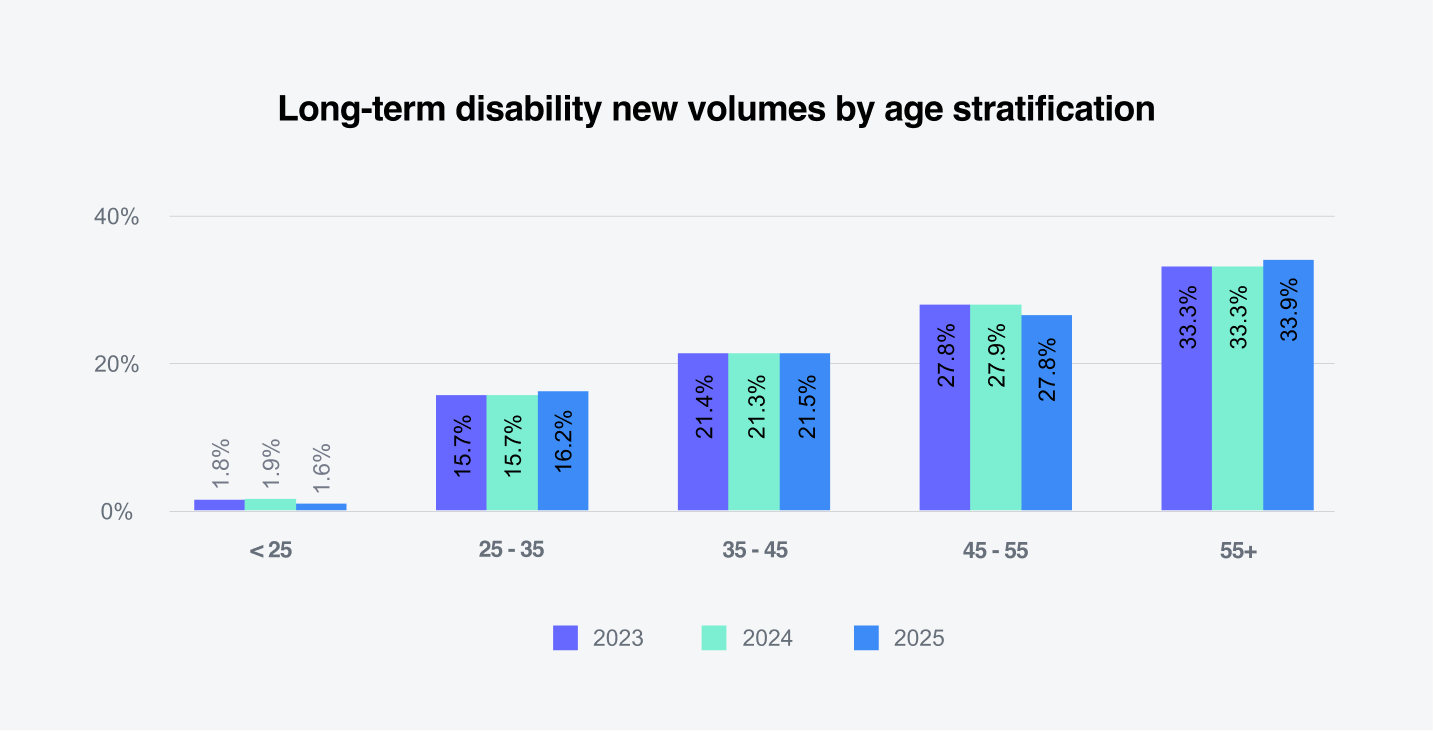
Claimants ages 55 and older recorded a 0.6% increase in claims transitioning to long-term disability. This continues a midyear trend reflecting more employees remaining in the workforce beyond traditional retirement age. Claimants ages 25–35 also saw a 0.5% increase, consistent with the broader trend of longer disability durations.
Future considerations
Mental health provider shortage
The supply of mental health providers continues to decline, with the projected shortage of psychiatrists widening. This shortage could result in longer wait times and extended mental health claim durations. Employers may consider expanding short-term disability plans to include clinical psychologists and psychiatric nurse practitioners, a step shown to reduce mental health denial rates. One area of concern is a move by the current administration to reclassify nursing as a nonprofessional degree. If implemented, the change would make future entrants into the field ineligible for federal loans and grants.
Mental Health Parity and Addiction Equity Act (MHPAEA)
Rules implemented in 2024 to strengthen the Mental Health Parity and Addiction Equity Act were rolled back in 2025. As a result, mental health regulations continue to operate under pre-2024 guidelines. Given the ongoing rise in mental health claims and the declining number of providers, the rollback could contribute to longer claim durations and an increase in comorbid mental health claims.
Rising medical and pharmacy costs
Although there is no direct impact, rising medical and pharmacy costs continue to pressure employers. In response, many have shifted costs in recent years to voluntary benefits that are fully funded by employees. In December 2025, four class-action lawsuits were filed on behalf of voluntary plan participants against employers, brokers and insurers, alleging fiduciary breaches under the Employee Retirement Income Security Act. While the cases are in early stages, a ruling in favor of the plaintiffs could reshape how insurers, brokers and employers structure and manage voluntary benefit programs.
Appendix
2025 YEAR-END