Claimants with
3–5 years of service
Similar to trends in disability and leave of absence, claimants ages 25–35 and 35–45 showed increased use of statutory benefits. Claimants with three to five years of service recorded the largest increase. Those with 5–10 years of service and 10–20 years of service posted modest gains.
The largest decline in usage occurred among claimants with less than three years of service, mirroring the decrease seen among employees younger than 25. While this decline may reflect workforce aging from the under-25 group into the 25–35 range, the trend will be monitored to determine whether it continues through 2026.
Paid family leave by state
New York
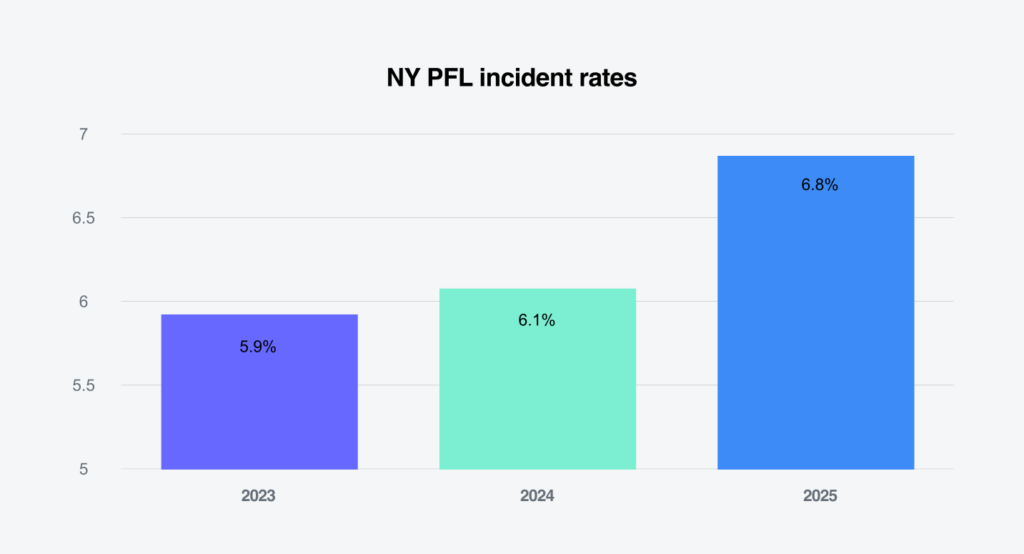
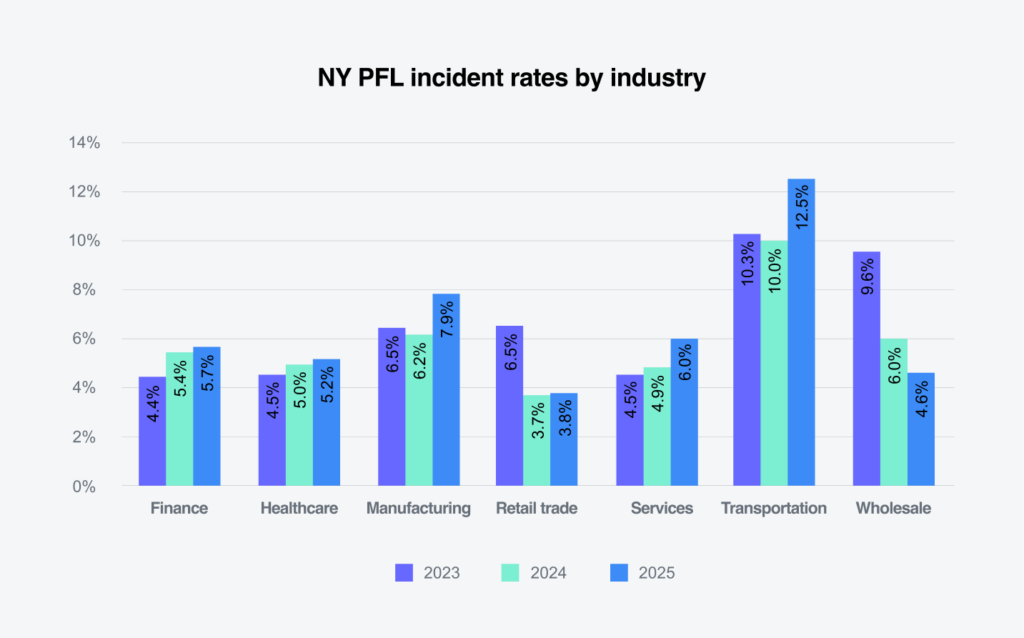
Incident rates in New York rose 0.7% in 2025, driven primarily by increased usage in the finance, manufacturing, services and transportation sectors. Wholesale trade was the only sector to decline, continuing a steady downward trend observed over the past several years. The sector will be monitored in 2026 to determine whether rates continue to fall or begin to stabilize as the industry adjusts following its 2022 and 2023 highs.
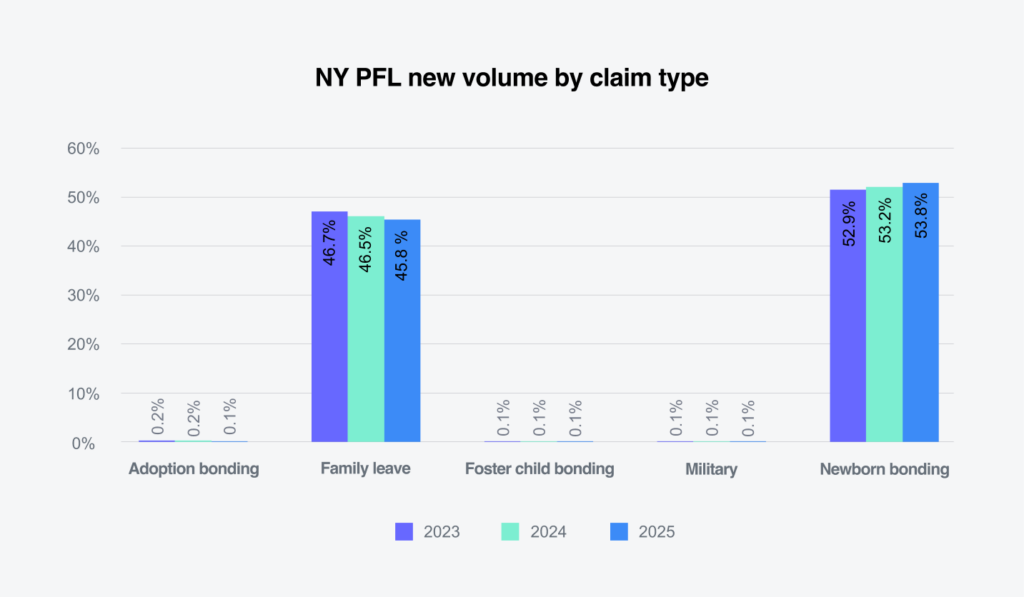
Newborn bonding and family care accounted for nearly 99% of all New York Paid Family Leave benefits. Newborn bonding continued to exceed family care by about 5%, a pattern that has remained consistent over the past three years. Adoption bonding represented less than 0.1% of claims in New York but, as noted in the leave summary, had a longer average duration for company-paid leave than newborn bonding.
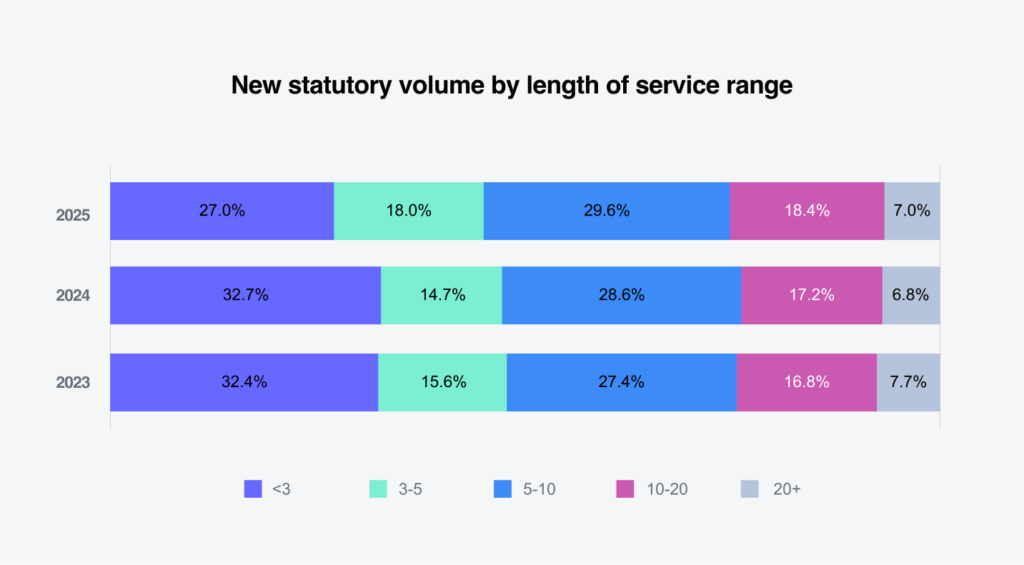
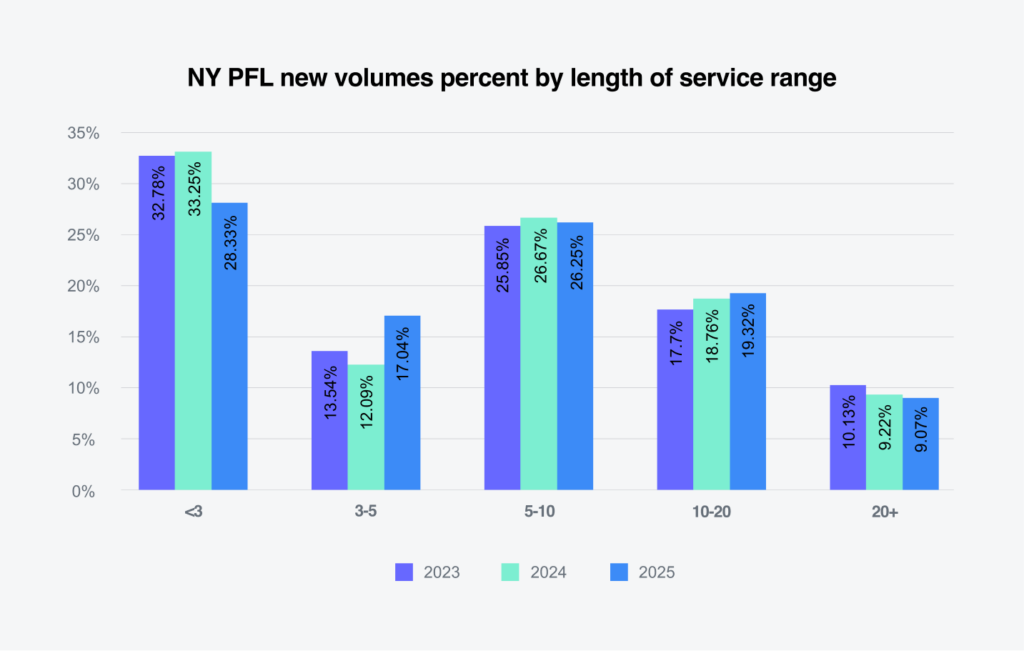
Unlike other benefit programs, claimants with fewer than three years of service recorded the highest volume of new claims, despite a 4.9% decline from 2024. Claimants with five to 10 years of service followed closely. Those with three to five years of service posted the largest increase, rising nearly 5%, consistent with trends seen across other benefit programs.
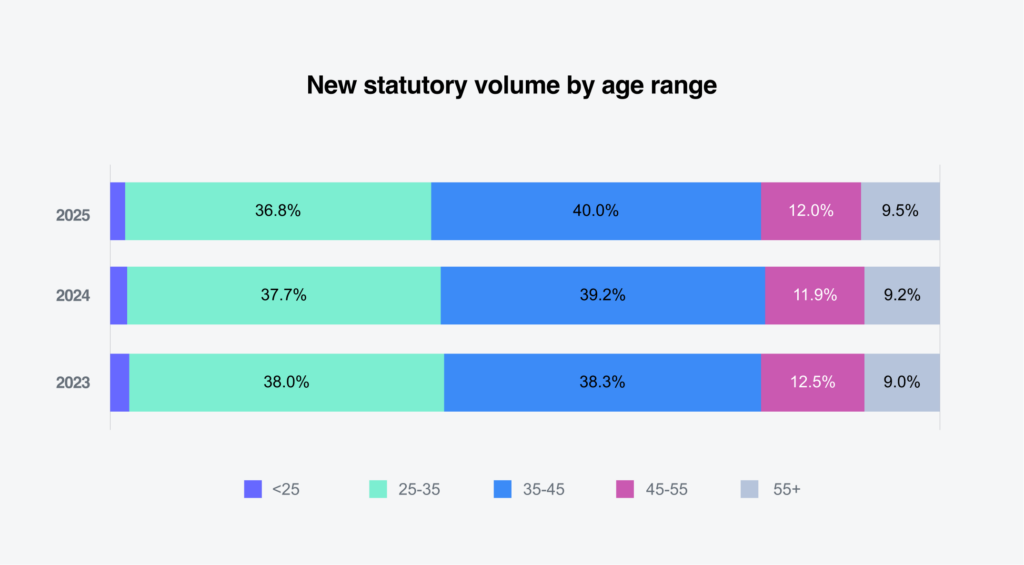
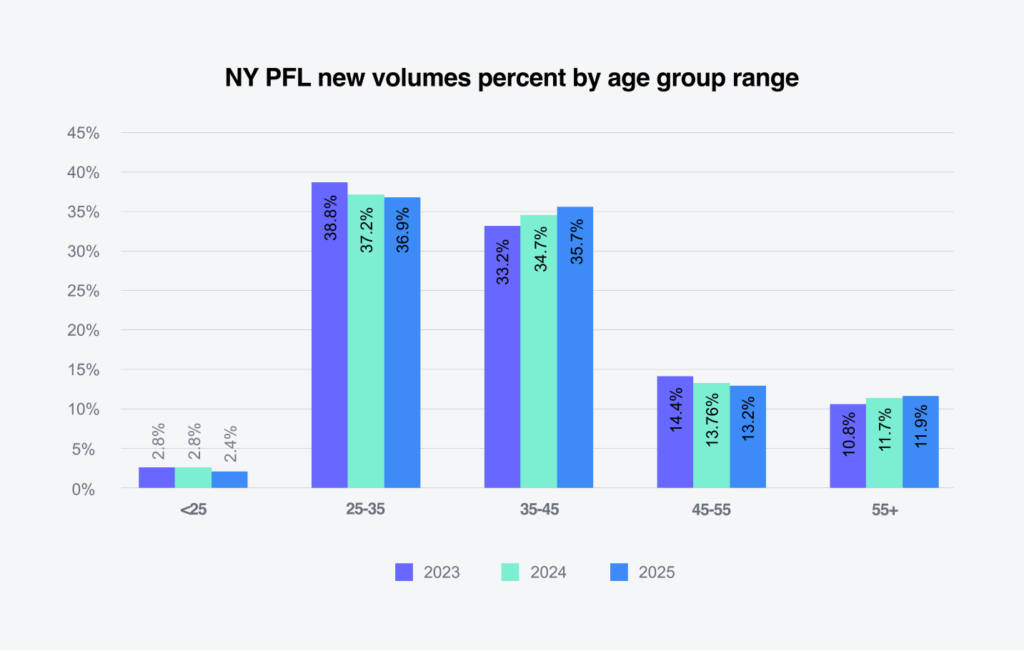
Claimants ages 25–35 and 35–45 continued to account for the highest usage. However, claims among the 25-35 age group declined slightly, with corresponding increases observed in the 35–45 and 55+ age groups.
California
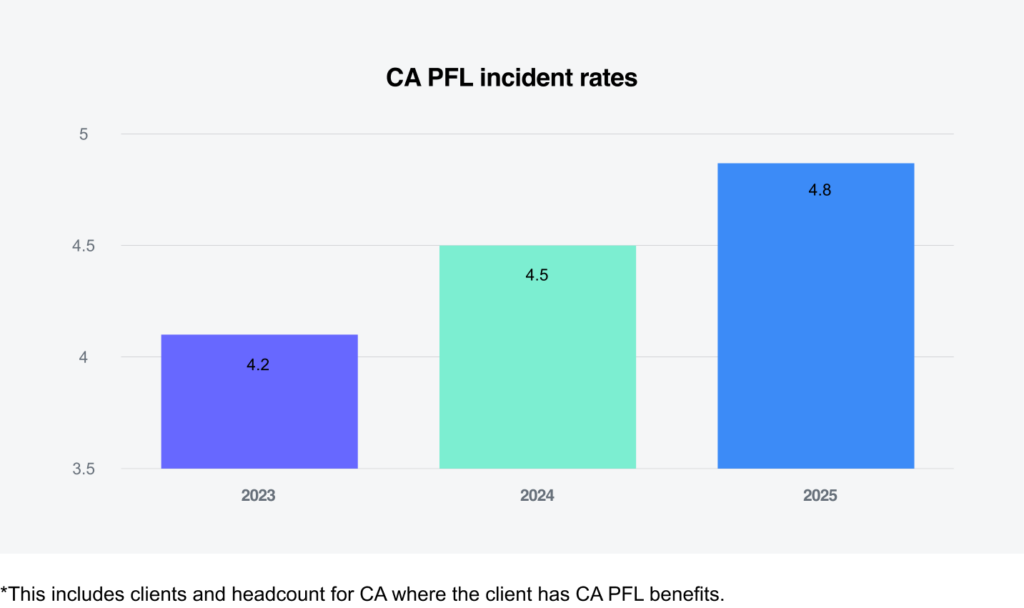
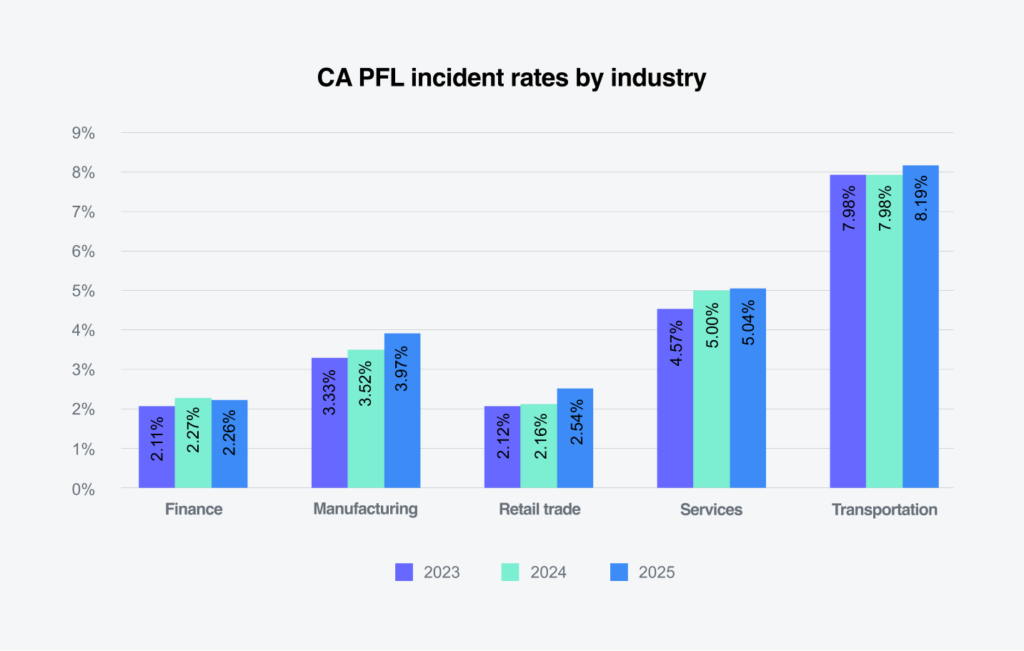
Similar to New York, California Paid Family Leave rates increased year over year, rising 0.3%. As noted last year, California continues to experience population declines as companies relocate operations to other states.
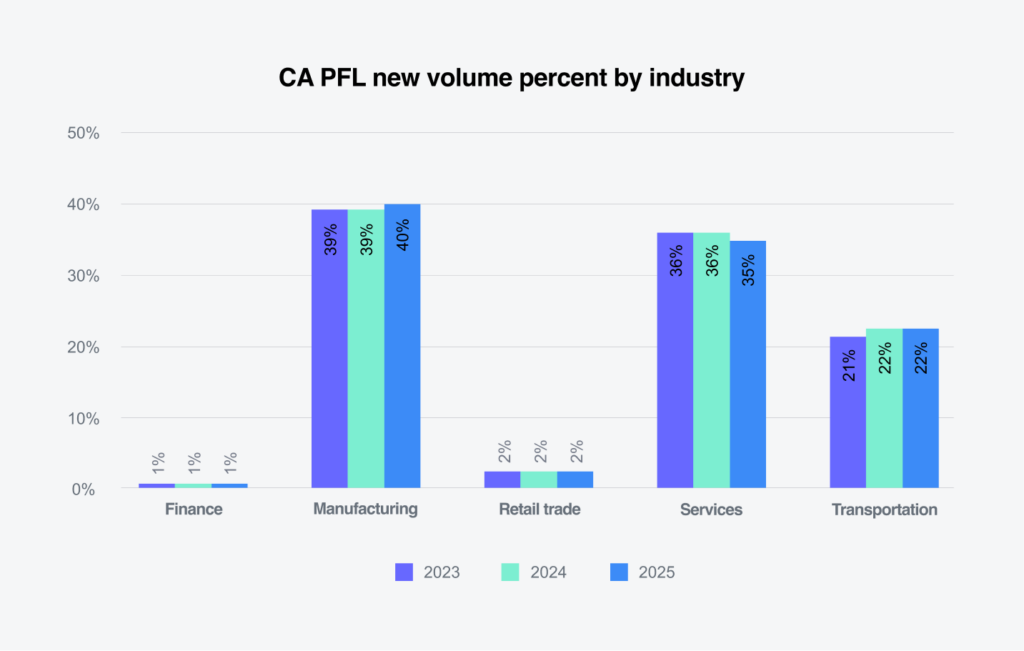
Transportation continued to post the largest growth in incident rates. Manufacturing and services, however, recorded higher overall claim volumes than transportation. Manufacturing accounted for a three-year high of 40% of claims, indicating continued growth in the sector statewide.
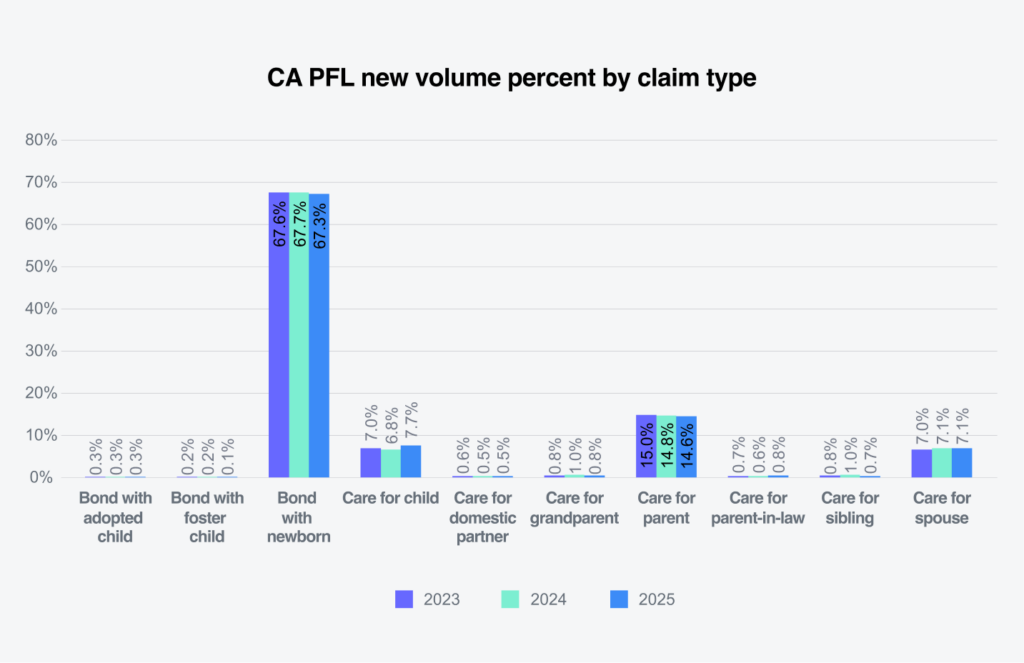
As in New York, bonding with a newborn accounted for 66% of all California Paid Family Leave claims. Claimants providing care for parents represented 14.6% of claims, a trend that warrants continued monitoring. This group exceeded claims for care provided to spouses or children. While California is the only state that reports this level of detail, similar patterns are expected in other states with statutory programs.
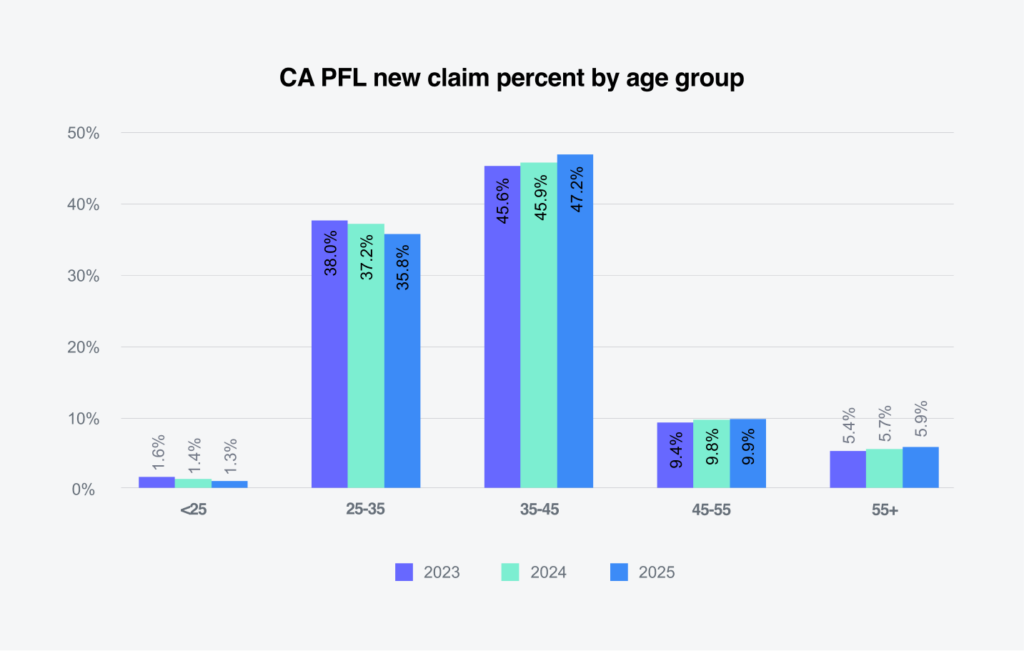
Claimants ages 25–35 and 35–45 accounted for 83% of California paid family leave claims. This aligns with patterns seen across other benefit programs; however, data indicate that claimants ages 35–45 are more likely to use Paid Family Leave for parental care than for newborn bonding. Claims by length of service followed trends similar to those observed in New York and other states with statutory programs.
Expansion of paid leave policies
Paid leave provides financial support and job protection, as required by state law, when employees need time off for a new child or for personal or family care. The COVID-19 pandemic underscored the importance of paid leave, contributing to increased support from employers and policymakers. While a federal paid leave program is unlikely in the near term, states continue to establish and expand their own programs. Recent updates include:
- Washington Paid Family and Medical Leave (WA PFML) — Effective Jan. 1, 2026, the state revised eligibility rules to allow more claimants to qualify earlier for benefits and job protection. Previously, claimants were eligible for job protection only after meeting Family and Medical Leave Act eligibility requirements.
- California Paid Family Leave (CA PFL) and State Disability Insurance (SDI) — Effective Jan. 1, 2026, the state added 12 weeks of neonatal intensive care unit coverage for newborns. This benefit is a separate bank of time than the in-force Colorado Family and Medical Leave Insurance (CO FAMLI) benefit.
- Maryland — Family and Medical Leave Insurance Program will be effective Jan. 1, 2028.
- Delaware — Delaware Healthy Families Act is effective.
- Minnesota — Paid Family and Medical Leave Act is effective.
- Maine — Paid Family and Medical Leave Act will be effective May 1, 2026.
- New York — In 2025, the New York Legislature proposed an increase in disability benefits to match paid family leave benefits, providing 67% of the average weekly wage for the first 12 weeks of medical leave. This has been reintroduced for the 2026 legislative session.
- Virginia — Proposed PFML twice in previous legislation sessions that were vetoed by the Republican governor. With a larger Democratic majority and governor, Virginia could be the next state to pass PFML legislation.
Wage replacement formulas
Recent state programs use a multi-part formula to provide higher wage replacement for lower-wage workers:
- WA PFML — 90%
Inclusive definitions of family
Many states have expanded the definition of “family member” to include grandparents, grandchildren, siblings, parents-in-law and domestic partners. Six states also include individuals related by blood or affinity:
- Washington PFML
- New Jersey Family Leave Insurance
- Connecticut FMLA and Paid Leave
- California Family Rights Act (CFRA)
- Paid Leave Oregon
- Colorado FAMLI
Maryland and Delaware have not adopted this broader definition, while Minnesota and Maine have included it in their PFML programs.