
2026 MID-YEAR
Workers’ compensation

Report Objectives
This report aims to summarize the present metrics for our workers’ compensation (WC) programs, assess the landscape of WC claims and litigation, and benchmark our patterns against comparable industry research. To aid our analysis, we utilized research from the following entities:
- National Council on Compensation Insurance (NCCI)
- California Workers’ Compensation Insurance Rating Bureau (WCIRB)
- Workers’ Compensation Research Institute (WCRI)
data parameters
Our practice team uses JURIS claims data to perform comparative analyses informed by their expertise and analytics. The data in this report is based on both insured and self-insured claims for all states across five 12-month periods (referred to as FY) from July 1, 2021, through June 30, 2026.
Executive summary
The WC environment remains financially stable.
Read more
- According to NCCI’s latest State of the Line Report, released during their Annual Insights Symposium on May 12, 2026, the WC system remains healthy, with private carriers notching their 12th consecutive year of underwriting profitability.
- AM Best’s Market Segment Outlook: U.S. Workers’ Compensation Insurance report notes that the WC line of coverage has been the most consistently profitable component of the commercial lines market and a primary driver of the property and casualty (P&C) industry’s profitability.
Yet, the environment is experiencing some challenges.
Read more
- The California WCIRB’s 2026 State of the System report, issued July 23, highlighted these key metrics:
- Premium rates increased 8.7% in 2025, with an additional increase of 6.6% for 2026 taking effect Sept. 1.
- The primary driver of frequency increases was cumulative trauma claims.
- California has longer claim durations than other states.
- 2025 saw a historically high combined ratio of 127%.
- Additional trends note increasing cost pressures in the years ahead that could influence claim frequency and severity, including:
- Growing employment levels
- Wage inflation
- Medical cost growth
- Demographic shifts within the workforce
- Evolving regulatory environments
Key observations
Taken together, these trends suggest that while claim costs continue to experience inflationary pressures, claims management effectiveness and resolution performance remain favorable.
1.3%
increase in WC claim volume from FY 2025 to FY 2026.
3.3%
increase in indemnity claim volume in FY 2026.
5.7%
increase in average paid per indemnity claim in FY 2026.
22.3%
rate of indemnity claims, remaining stable in FY 2026.
1.8%
medical inflation rate, remaining relatively moderate in FY 2026.
Overall claim closure rates improved.
Average claim durations continued to decline.
Litigation rates remained essentially unchanged.

Download a summary slide with these key observations.
Claim volume reflects economic growth
One of the clearest trends in FY 2026 was the return of claim growth following essentially flat results in FY 2025.
Claim volume for FY 2026 increased 1.3% over FY 2025 — a 3.3% increase for indemnity claims and a 0.8% increase for medical-only claims.
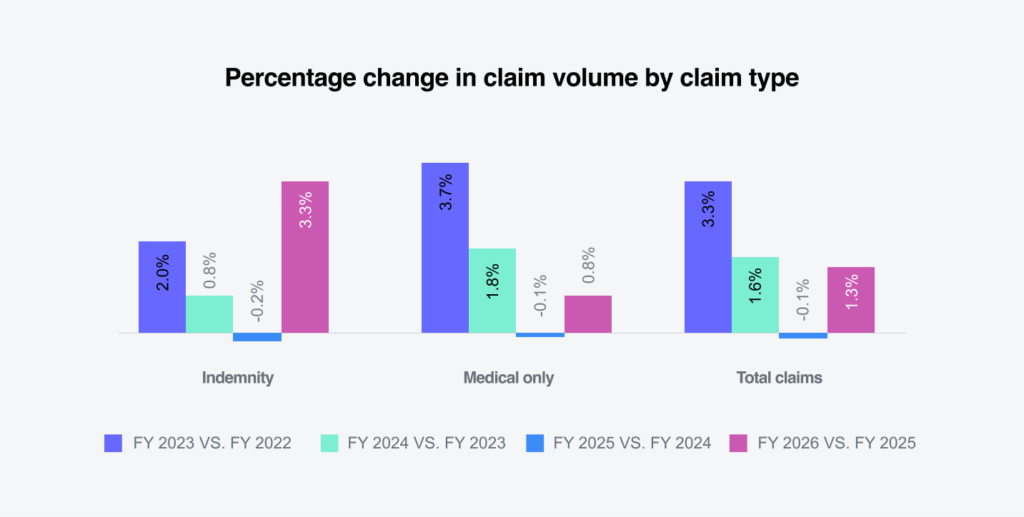
This increase mirrors broader labor market growth. According to the Bureau of Labor Statistics (BLS), employment growth accelerated significantly during the last half of 2025 and first half of 2026, creating additional payroll exposure across many industries.
Our industry data further demonstrates where much of this growth occurred. Construction claims increased nearly 25%, while the services, transportation, healthcare, energy and paper products sectors experienced growth above the overall average. Additionally, NCCI’s Labor Market Insights report of July 2, 2026, highlighted solid employment growth in construction, professional services and healthcare, and indicated strong acceleration in the first half of 2026 as compared to 2025.
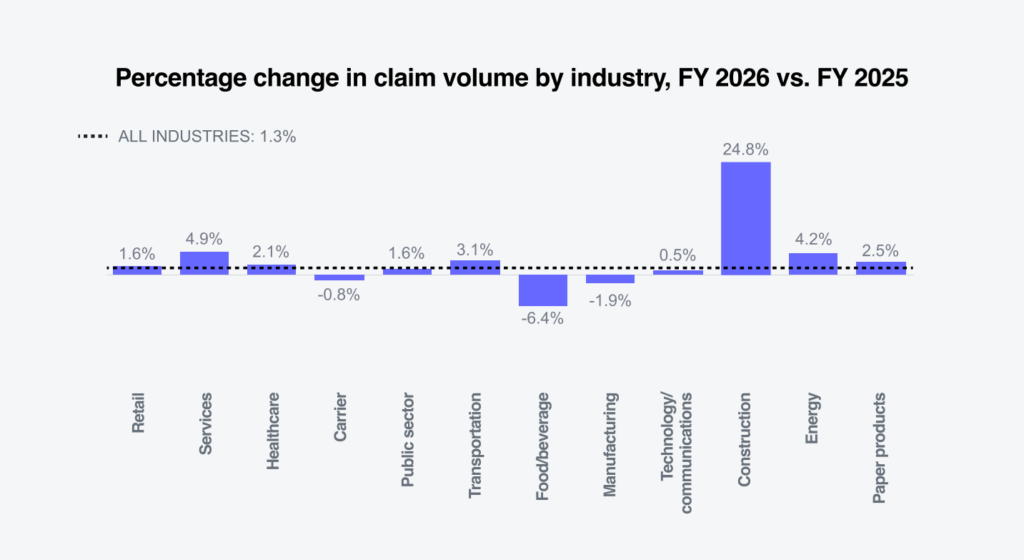
Rather than indicating deteriorating workplace safety performance, the volume increases largely reflect an expanding workforce and increased economic activity.
Age demographics continue to shift
3.5%
increase in claim frequency for the 60-plus age group.
Our age group analysis reveals a trend that’s likely to have long-term implications for WC costs.
The 60-plus age group experienced the largest increase in claim frequency for FY 2026 (3.5%), continuing a pattern observed over the past several years. Conversely, claim frequency among workers aged 50-59 declined.
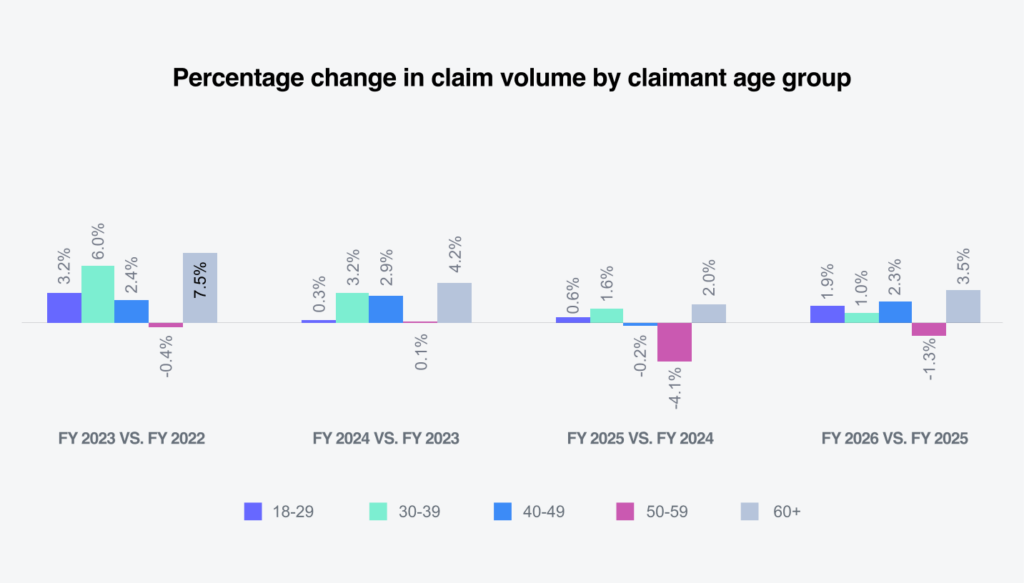
This trend aligns with U.S. labor force projections showing continued growth in workforce participation among employees aged 65 and older. According to the BLS, for 2023-2033, the core of the labor force will continue to comprise workers age 35-44. However, workers aged 65 and older are projected to experience the fastest growth in labor force participation. Their share of the labor force will increase from 6.7% to 8.6% over the projected period, while the share of workers aged 16-24 is projected to decline from 13.2% to 11.6%.
The importance of this shift becomes evident when reviewing indemnity rates. While the overall indemnity rate for FY 2026 held steady at 22.3%, workers aged 60 and older continue to produce the highest indemnity rate at 29.2%.
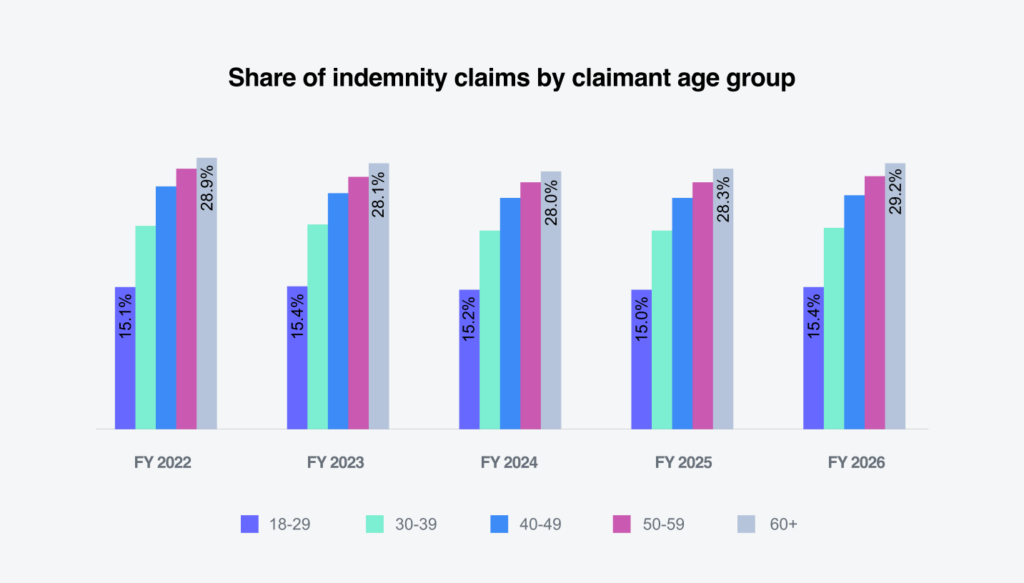
The data suggests that workforce aging will likely remain one of the most important contributors to future claim severity.
Indemnity cost pressures are driven primarily by inflation
5.7%
increase in average paid in FY 2026.
There was a 5.7% increase in the average paid per indemnity claim in FY 2026, as compared to FY 2025. This was driven by an increase of 5.2% in indemnity paid, 5.3% increase in medical paid and 9.2% in expense paid.
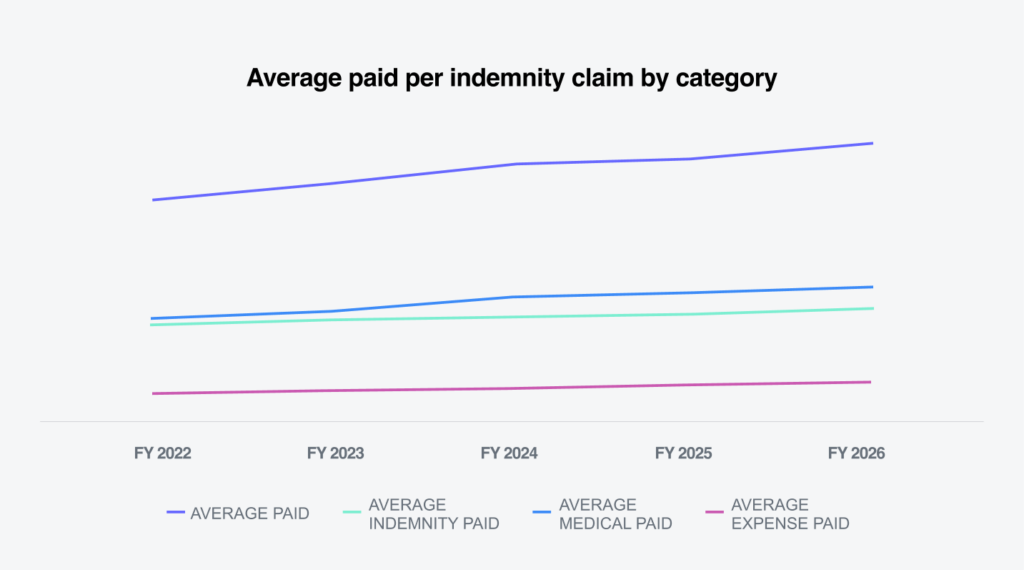
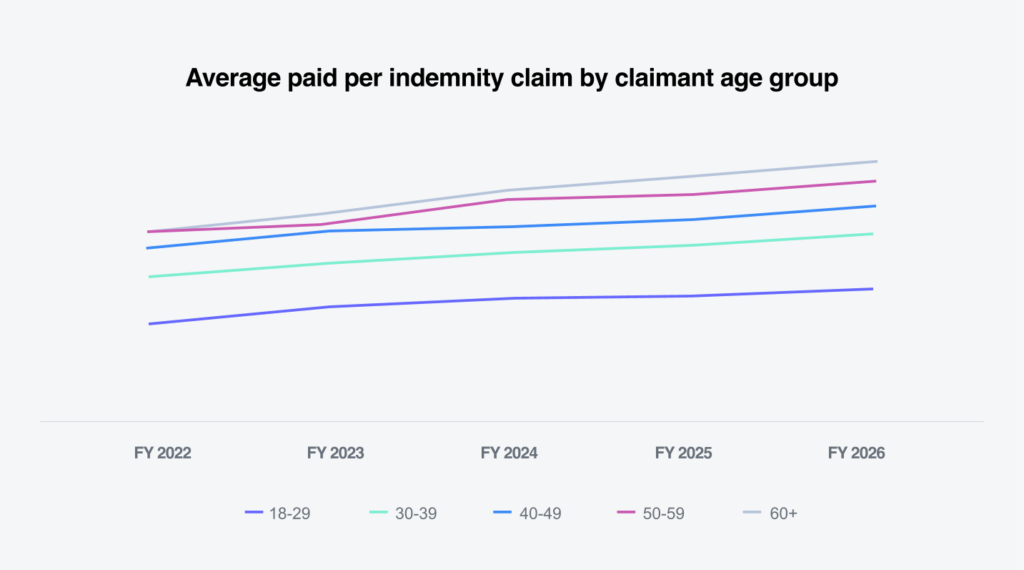
The largest increase in the average paid per indemnity occurred in the 30-39 age group (7.4%), followed by the 18-29 group at 6.0%, the 40-49 and 60-plus groups at 5.5%, and 50-59 group at 5.3%.
Although the 30-39 group experienced the highest percentage increase, claim severity remains most heavily influenced by older workers. The 60-plus age group, despite a smaller percentage increase, generate higher average wages and significantly greater medical utilization, which contributes more materially to claim severity and overall costs.
Importantly, much of this growth appears linked to wage inflation and rising benefit levels, rather than dramatic changes in claim behavior. The temporary total disability (TTD) paid per day analysis shows that indemnity benefits increased 5.3%, almost exactly matching the growth in average indemnity costs.
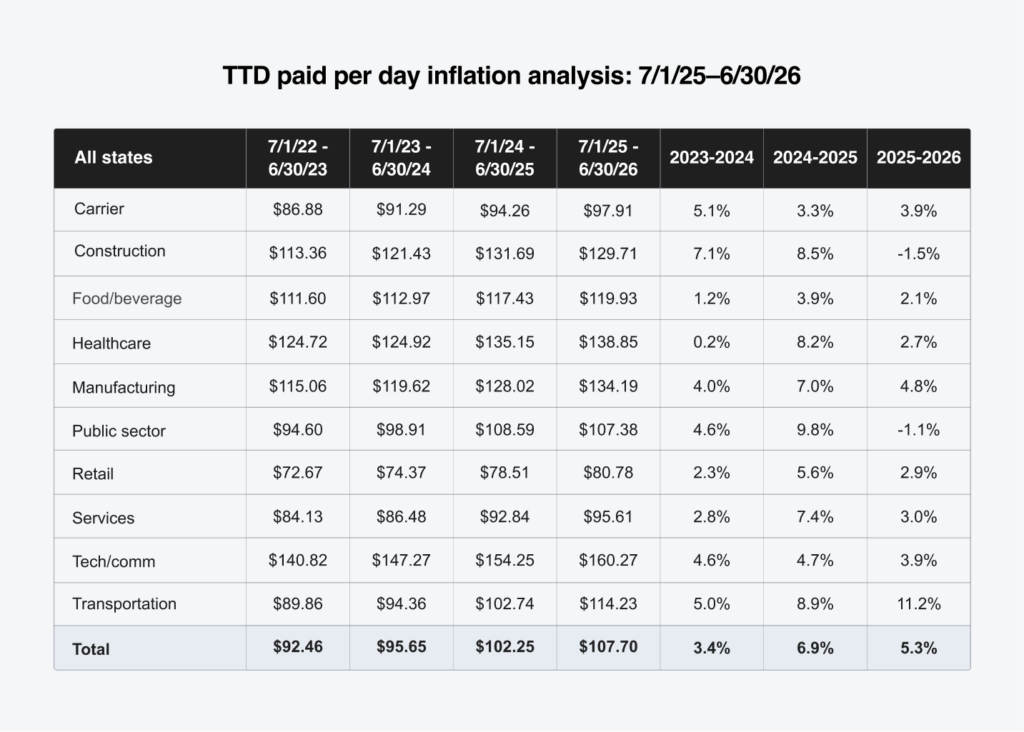
The transportation industry experienced the largest increase in daily disability payments (11.2%), while the manufacturing, carrier and technology sectors also showed notable increases.
These results suggest that rising compensation costs are increasingly influenced by labor market conditions and wage growth.
Medical inflation remains manageable
4.7%
increase in average medical payments.
Medical costs remain the largest component of claim severity. Average medical payments per indemnity claim increased 4.7% during FY 2026.
Physician-directed care continues to drive most medical spending. Physician services represented approximately 61% of total medical expenditures in FY 2026, compared to 59% in FY 2025.
Meanwhile, facility spending remained relatively stable and pharmacy costs declined slightly.
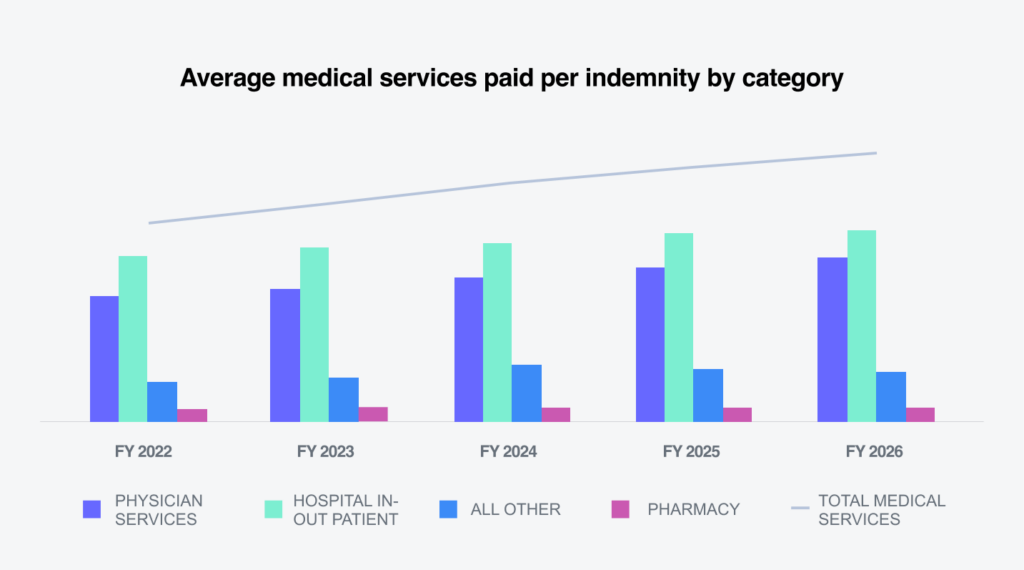
However, underlying medical price inflation was measured at only 1.8%.
The medical inflation analysis indicates that price increases remained relatively modest across major treatment categories.
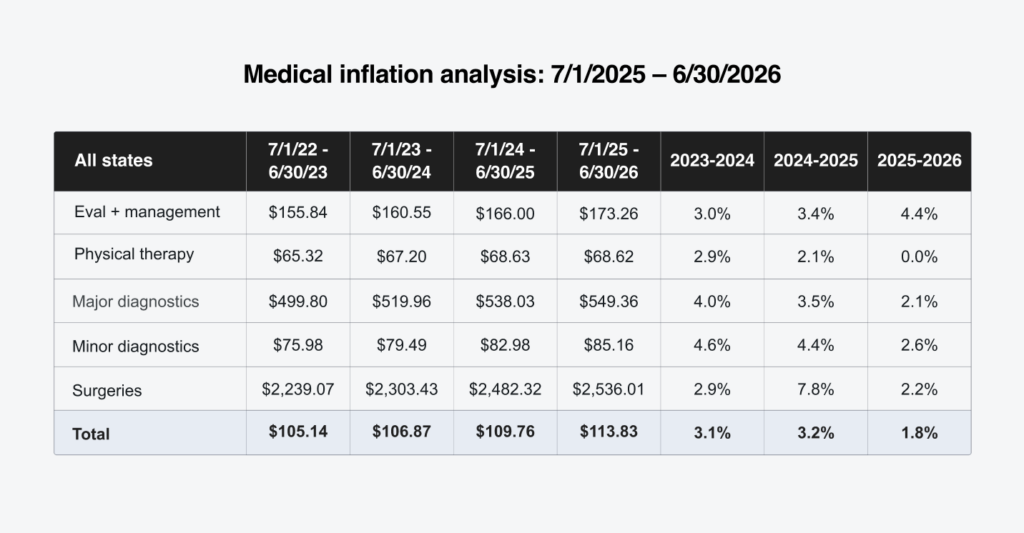
It’s worth noting, however, that many jurisdictions experienced substantially higher growth. Fourteen states had medical inflation of 5% or higher, with Louisiana having the largest increase (31%), followed by Florida (18%), Vermont (17%) and New Jersey (10%). These results demonstrate that medical inflation continues to be driven by state-specific conditions and reinforce the need to monitor emerging jurisdictional pressures that may influence future medical severity and claim costs.
Impact of state fee schedules
State medical fee schedules play an important role in controlling WC costs. Our analysis found that fee schedule states experienced a 1.4% increase in medical prices, compared to a 4.92% increase in non-fee schedule states — showing that fee schedules continue to be an effective mechanism for moderating provider reimbursement growth.
The modest increase in medical prices observed in FY 2026 suggests that fee schedule regulation, combined with medical cost containment initiatives, help mitigate the impact of healthcare inflation on WC claim costs. Our medical bill review solutions further support these efforts by:
- Applying appropriate state fee schedules
- Identifying billing inaccuracies, overcharges and coding discrepancies
- Leveraging network discounts through our broad network, when available
- Negotiating with medical providers to maximize savings and ensure appropriate reimbursement
Workforce aging continues to affect severity
2x
Average incurred claim costs for workers over 60 are twice that of workers under 30.
The relationship between age and claim cost remains one of the most consistent findings throughout the report.
Aside from what was previously noted regarding indemnity claim counts and payments, average medical payments per indemnity claim increase steadily with age.
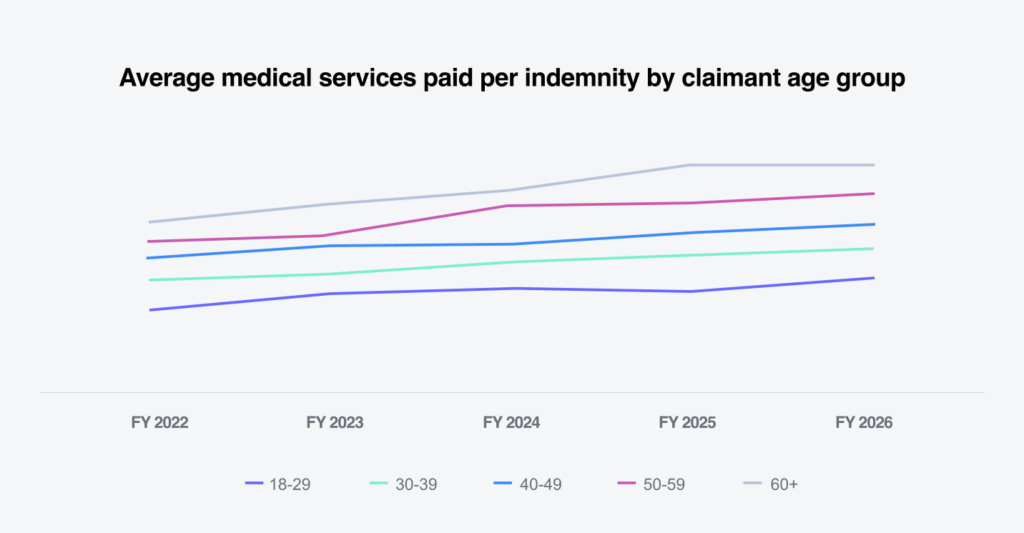
The 60-plus age group now averages double the average incurred for employees under age 30.
As people age, preexisting conditions and comorbidities can complicate recovery, extend treatment duration and contribute to higher overall medical costs. This trend is consistent with research from the CDC’s National Institute for Occupational Safety and Health (NIOSH), which indicates that while older workers generally experience fewer workplace injuries than younger employees, when injuries do occur after age 60, they’re more likely to be serious or fatal.
The duration tables reinforce this relationship. Older workers continue to experience longer recovery periods, resulting in higher disability payments and increased medical utilization.
As the labor force ages, organizations should expect workforce demographics to become an increasingly significant driver of claim severity.
Closure performance continues to improve
1.0%
increase in all claims closed in FY 2026.
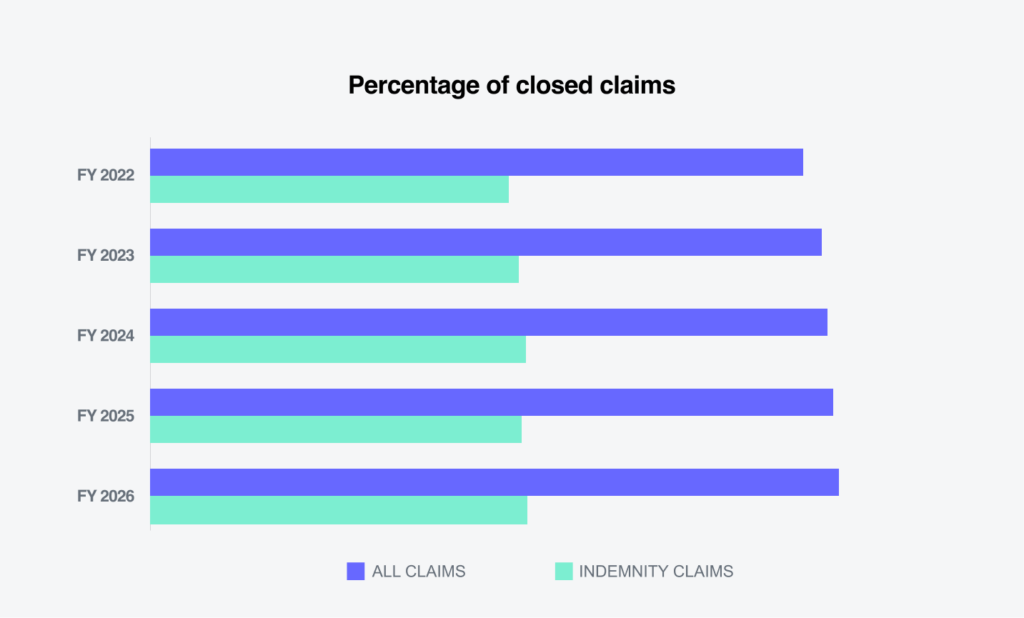
Claim closure rates continued to improve in FY 2026, increasing 1 percentage point over FY 2025.
At the same time, average claim durations continued to decline — a three-day overall reduction, four-day reduction for indemnity claims and three-day reduction for medical-only claims.
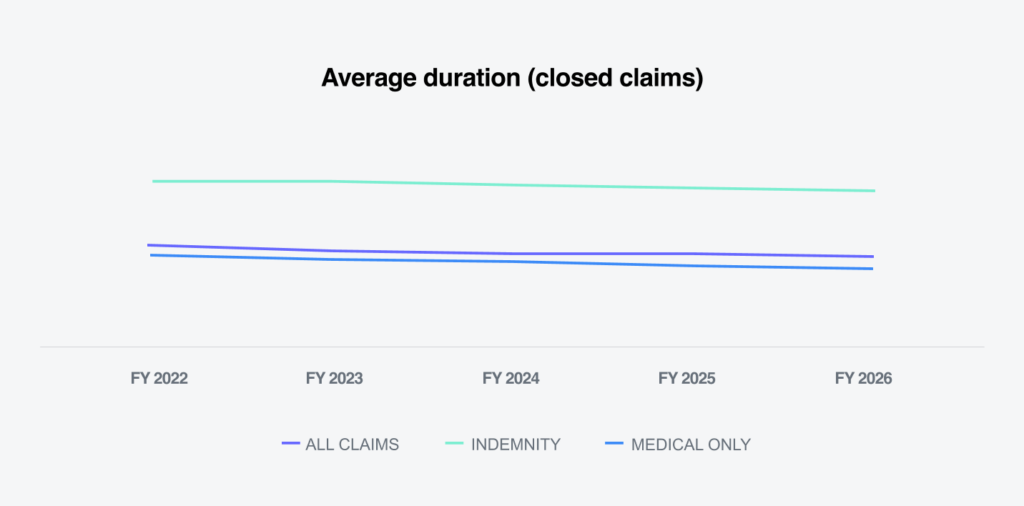
These trends indicate a positive direction influencing overall claim outcomes.
Allocated loss adjustment expenses
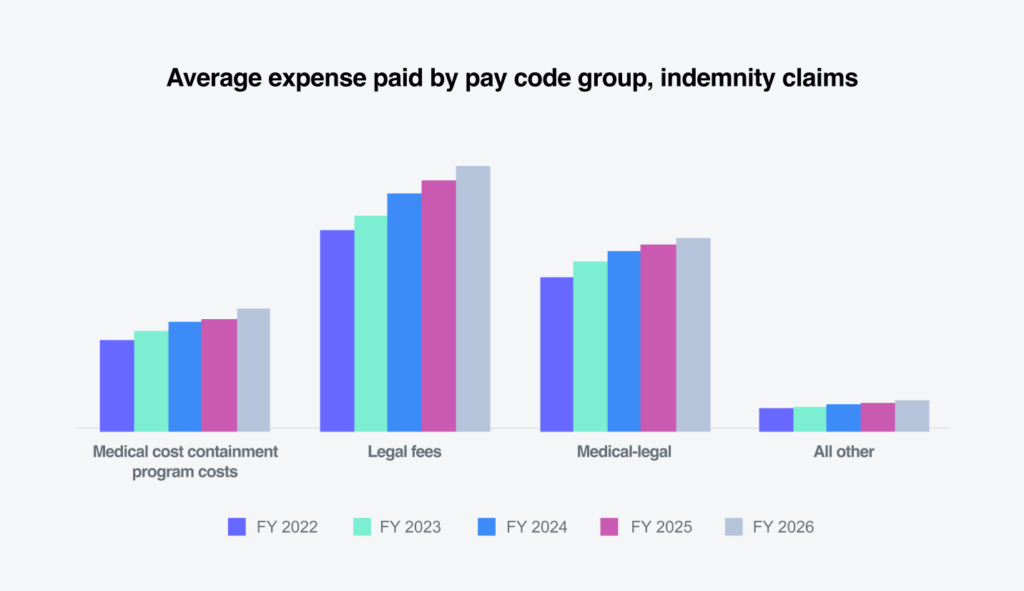
Allocated loss adjustment expense (ALAE) costs per indemnity claim comprise the following categories:
- Medical cost containment program costs: Incurred to ensure medical treatment is necessary, appropriately priced, aligned with evidence-based guidelines and compliant with state fee schedules — ultimately reducing total medical spend
- Legal fees: Incurred in the defense or resolution of a WC claim
- Medical-legal: Arise when medical expertise is needed specifically for legal or adjudicatory purposes
- All others: Additional claim-specific expenses incurred for accurate liability determination, fraud prevention and claim resolution
Average expenses paid increased in each of these categories. Medical cost containment showed the largest increase (8.2%), followed by legal fees (4.9%) and medical-legal (3.8%). The percentage increases for legal fees and medical-legal were lower than those in FY 2025.
Litigation remains a key cost driver
13.8%
litigation rate for pending indemnity claims in FY 2026.
While litigation rates for pending indemnity claims remained flat at 13.8%, litigated claims continued to represent a disproportionate share of total claim costs.
The litigated claim chart demonstrates the impact, with litigated claims incurring roughly twice the value of non-litigated claims.
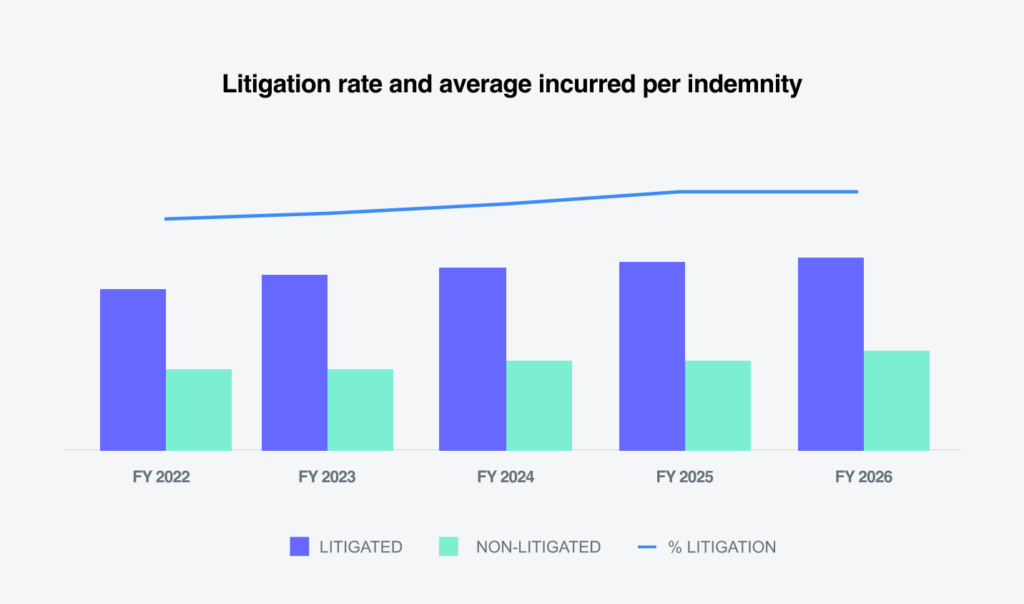
Although litigation frequency has remained relatively stable, the cost differential highlights the ongoing importance of early communication, employee engagement, prompt benefit delivery and timely claim resolution.
Even small increases in litigation rates can significantly affect overall severity results.
Looking ahead
As we navigate 2026, the U.S. workplace continues to evolve at an unprecedented pace — profoundly impacting WC across medical, legal, regulatory and workforce dimensions.
Workforce demographic shifts
Shifts such as occupational composition, age of the workforce and where people work affect injury risks, outcomes and the cost of WC claims.
Many employers are now operating with four, or even five, generations in the workplace — from Gen Z through traditional retirement-age workers.
These changes have noteworthy implications for WC:
- Younger workers often have higher injury frequency due to inexperience and job mobility.
- Older workers generally have lower frequency but higher severity injuries.
- Training, safety communication and return-to-work strategies must be customized for different workforce segments.
Medical accessibility/costs
Medical costs and claim severity are expected to continue rising, driven by ongoing challenges across the healthcare system. Key factors include:
- Nationwide physician shortages: According to the Health Resources & Services Administration’s Physician Workforce: Projections, 2023-2038 and Nurse Workforce Projections, 2023-2038, published in December 2025, the U.S. could face a shortage of up to 141,160 full-time physicians and 108,960 full-time nurses by 2038. Expanded use of nurse practitioners and physician assistants may offset gaps in certain fields.
- Market consolidation: Hospitals, physician practices and other healthcare entities continue to merge or get acquired. This has led to higher healthcare prices and reduced patient access in rural parts of the country.
- An aging workforce: Older people tend to have more underlying chronic conditions that contribute to more intensive medical treatment.
- New medical technologies and treatments: These innovations offer advantages like decreased risk and faster recovery times but often carry greater costs than more traditional approaches.
- Taxation: The implementation of tariffs is expected to raise the cost of imported durable medical equipment (DME), diagnostic equipment, surgical implants, supplies and pharmaceuticals.
WC will not be immune to these trends. To keep claim costs in check, it’s critical that medical expenses and utilization continue to be managed using the types of controls developed in recent years.
Technology transformation
Technology plays an increasingly significant role in reshaping the WC industry. Artificial intelligence (AI) and automation are present-day realities already making an impact.
- AI usage is streamlining claims processing, improving efficiency, enhancing decision-making, strengthening fraud detection and helping to reduce claim costs and operational risk.
- The integration of AI capabilities within our OmniInsights intelligence platform accelerates claim triage and review, ensuring every claim is handled with the appropriate level of engagement and attention.
- OmniInsights utilizes AI-driven medical summaries to extract and consolidate key medical information, empowering our claims professionals to make timely, informed decisions while focusing their attention on claim strategy and resolution.
- Telemedicine enables injured workers to receive medical consultations remotely, thereby improving access and convenience.
- Wearable technology facilitates the collection of data and information that can potentially lead to safer workplaces, facilitate return to work and reduce the overall cost of WC claims.
This transformation brings new challenges and significant opportunities, positioning the industry for more proactive, data‑driven and worker-centric approaches to claims management.
Heightened regulatory environment
WC is heavily regulated at the state level. There are, however, also federal policies that affect WC for federal employees and longshore and harbor workers.
Forty-six state legislatures convened for regular sessions in 2026, with 10 state legislatures still convening as of mid-August (either in regular or active special session).
- Recent legislative activity has expanded compensability in several jurisdictions through occupational disease and mental health presumptions for first responders. California, Maryland, Virginia and Wisconsin expanded presumptions related to post-traumatic stress disorder (PTSD), cardiovascular conditions and occupational diseases.
- Several states took steps to enable injured workers to choose their own doctors:
- Washington: WA SB 5847, which took effect June 11, 2026, gives workers the right to seek initial, emergency and further treatment with a provider of their choice. It also prohibits employers from requiring or coercing an injured worker to seek medical treatment from a specific provider or clinic.
- Colorado: CO HB 25-1300, which goes into effect Jan. 1, 2028, allows injured workers to select their own treating physician from the Division of Workers’ Compensation’s accredited level I or level II physician list.
- Indiana: IN HB 1069 was introduced but did not advance. It would have allowed injured workers to choose their own attending physician.
- Leadership within state WC agencies has recently transitioned in several jurisdictions, with more changes anticipated as a result of retirements and upcoming elections.
2026 elections
Elections will take place across the country on Nov. 3, 2026, when voters will determine the composition of the 120th U.S. Congress. All 435 seats in the House of Representatives and 35 of the 100 Senate seats will be on the ballot. In addition, 36 states will hold gubernatorial elections, along with numerous state and local contests nationwide. Four states — California, Georgia, Kansas and Oklahoma — will also elect insurance commissioners.
The outcomes of the 2026 elections will influence WC because the system is governed almost entirely at the state level, with federal policy shaping the broader labor and economic environment.
As the WC landscape continues to evolve, Sedgwick is closely watching trends and remains committed to using data, technology and expert resources to reduce claim severity, control costs and enhance outcomes for injured workers and employers alike.
Conclusions
FY 2026 data points toward several emerging trends likely to shape WC performance over the next several years:
- Rising wage levels are increasing indemnity costs.
- Workforce aging is contributing to higher severity and longer recovery periods.
- Medical inflation remains relatively contained but varies significantly by jurisdiction.
- Medical utilization continues to concentrate around physician-directed care.
- Litigation remains one of the largest differentiators between low- and high-value claims.
- Faster claim closure and reduced duration are critical drivers of favorable outcomes.
While WC remains one of the healthiest commercial insurance lines, the data suggests employers should closely monitor demographic changes, inflationary pressures and regulatory developments moving into 2027. The strongest opportunities for controlling future costs continue to be effective return-to-work practices, proactive medical management, workforce safety initiatives and early claim intervention.
2026 MID-YEAR