
2026 MID-YEAR
Property loss adjusting

Report Objectives
data parameters
Our practice team uses claims data to perform comparative analyses informed by their expertise and analytics. This report is based on data for U.S. claims only, though it’s important to note that Canada and Latin America are also significant pieces of our property Americas business.
Key observations
At the end of 2025, we characterized the softening in claim activity as a cyclical pause, rather than a structural shift, and noted that when conditions changed, operational demand would respond quickly. The first half of 2026 delivered on that expectation — in the precise shape the data anticipated. Claim activity reaccelerated, driven not by a single catastrophic event but by a concentrated sequence of mid-sized losses, including winter storms, a historic Southern freeze and a period of intense storm activity.
Risk shift
Frequency returned before severity relented
Claim reality
Dispersed, mid-sized events; no peak CAT
Operating response
Surge absorbed within adaptive capacity
Enablers
Governed AI and expert judgment
Outcome
Consistent outcomes through the inflection
The implications for claims operations
The pause ended on schedule.
New claim intake rose roughly 12% versus the second half of 2025 — essentially back to year-ago levels — with catastrophe-driven assignments returning after the quietest CAT period in recent memory. This is confirmation that lower volumes reflected claim formation dynamics, not reduced exposure.
Frequency, not severity, defined the first half of 2026.
The U.S. recorded 12 $1 billion weather events through June, the fifth-most on record for a first half — though losses remained moderate as activity was spread across mid-sized events.
Winter and freeze perils punched above their weight.
Two January-and-February winter storms — including a late-January ice-and-snow event stretching from Texas to the Northeast — and a record Florida freeze generated peak-season-scale losses in the opening weeks of the year, reinforcing the need for year-round readiness.
AI moved from adoption to governance.
The differentiator is no longer whether carriers use AI, but if they can scale it inside governed, human-centered workflows as regulatory expectations formalize.
What this means for insurers and risk managers
Treat quiet quarters as staging, not signal.
The first quarter’s calm gave way to a compressed March-through-June storm run. Capacity plans should assume rapid inflections.
Manage the portfolio of events, not the event.
Clustered, geographically dispersed activity strains cycle times and coordination differently than a single landfall. Segmentation and escalation paths matter more than surge headcount alone.
Hold the line on severity discipline.
Labor, materials and coverage-adequacy pressures persisted through both the quiet and active periods.
Demand governance from AI investments.
Regulatory expectations around validation, documentation and auditability are now explicit. Scaled value will accrue to governed deployments.

Download a summary slide with these key observations.
The 2026 risk environment: Frequency without a headline event
$31.9B
in climate disaster damage in FY 2026.
According to Climate Central’s mid-year update, the first half of 2026 produced at least 12 separate billion-dollar weather and climate disasters in the U.S. — the fifth-most for any January-to-June period since records began in 1980 and more than double the long-term first-half average of about five — resulting in at least $31.9 billion in damage.
Counts and costs reflect the data as of July 2026 and may rise as additional events are assessed. Notably, no single event approached the scale of a peak catastrophe. Gallagher Re reports that no insured loss event exceeded $10 billion in the half, extending a streak of five consecutive quarters without such an event, and Munich Re estimates global insured losses at $44 billion — below the 10-year average and well below the five-year average of $66 billion.
The sequencing was just as important as the count. The year opened quietly — severe convective storm activity started later than usual — before compressing into an intense March-to-June run. Per Gallagher Re, March alone produced at least 204 confirmed tornado touchdowns, the third-highest March total since 1950, with the costliest outbreak (March 10-12) generating more than $2.3 billion in insured losses across 14 states. From March through June, eight billion-dollar severe storm events accumulated across the central U.S., the costliest of which — a late-April outbreak across the Midwest into Texas — caused an estimated $6.8 billion in damage.
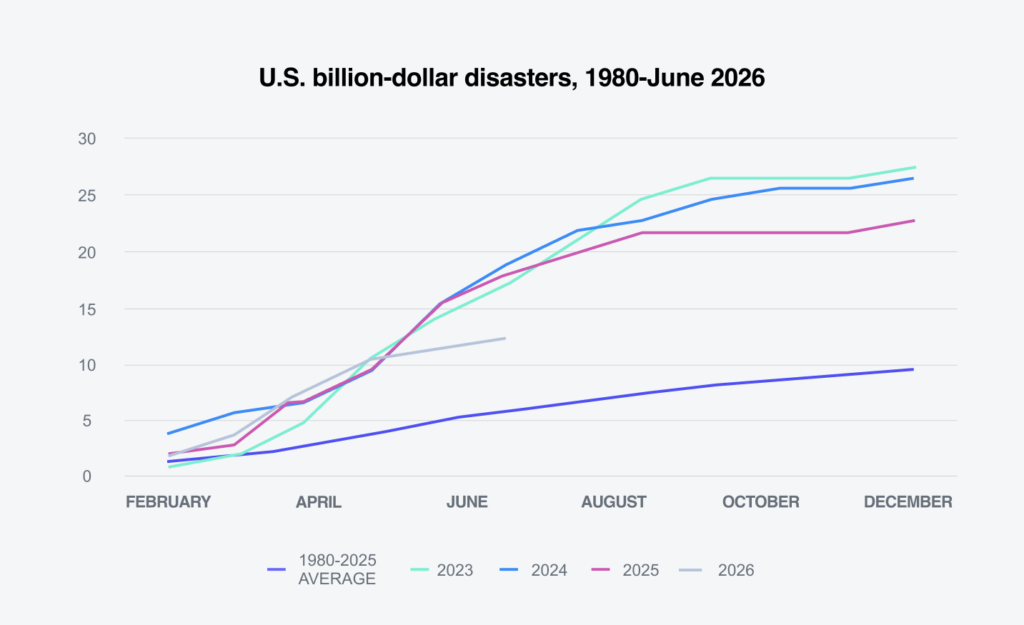
Cumulative U.S. billion-dollar disasters by month, 2026 versus 2023-2025 and the 1980-2025 average. Source: Climate Central (reproduced under CC BY 4.0).
Why this matters now: This is the operating pattern our prior editions have described — recurring, mid-sized events producing sustained disruption without a defining catastrophe — now visible within a single half-year. Cumulative exposure builds, even when no individual event commands national attention, and demand arrives in clusters rather than waves.
More events, closer together
The first half of 2026 builds on a decades-long trend. The average number of U.S. billion-dollar disasters has climbed from roughly three per year in the 1980s to 20 per year over the last decade, with 2023 and 2024 setting records at 28 and 27 events and 2025 following with 23. Just as important for claims operations, the time between events is collapsing: The average interval has fallen from 82 days in the 1980s to 16 days over the last 10 years, and to just 10 days in 2025. Back-to-back events compress recovery windows, strain contractor and adjuster availability, and are the direct mechanism behind the clustering that drove the March-to-June surge.
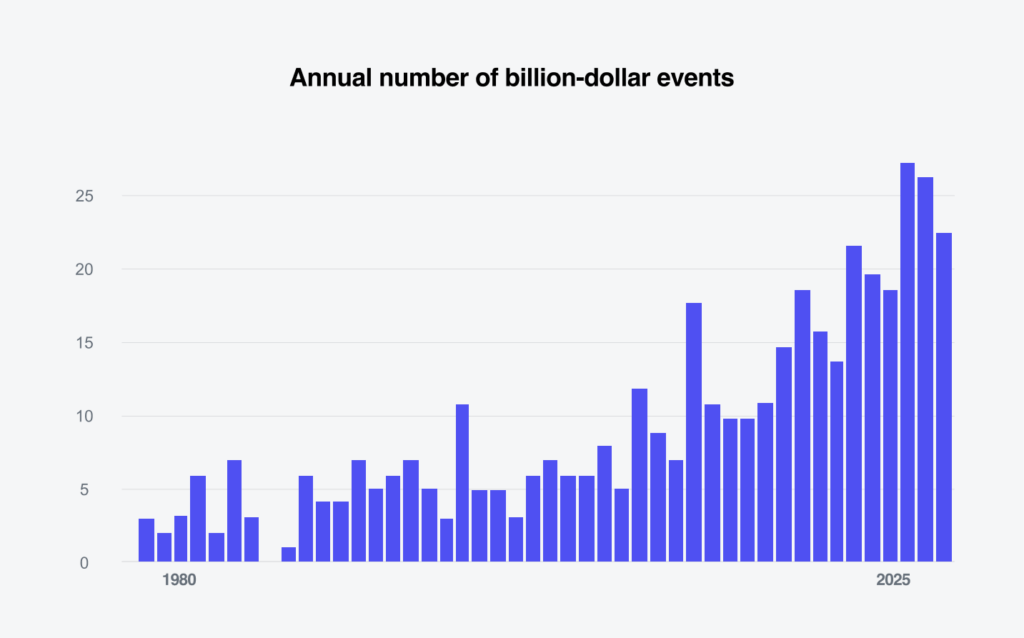
Annual number of U.S. billion-dollar weather and climate disasters, 1980-2025. Source: Climate Central (CC BY 4.0).
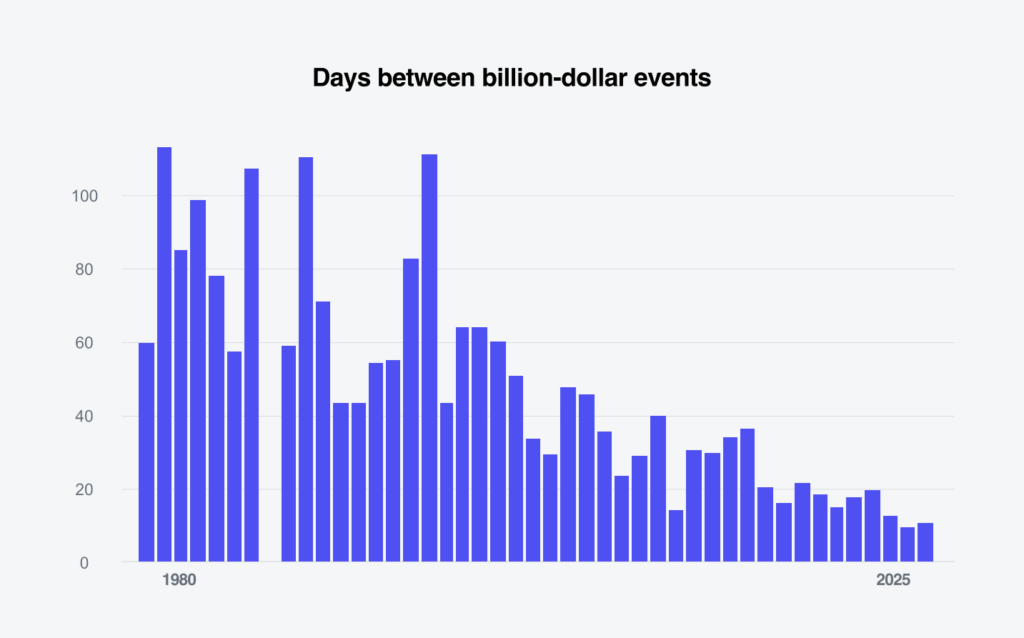
Average days between U.S. billion-dollar events by year, 1980-2025. Source: Climate Central (CC BY 4.0).
The peril mix keeps broadening
8
billion-dollar events were severe convective storms.
Severe convective storms again dominated, accounting for eight of the 12 billion-dollar events. But the remaining four illustrate how far activity has moved beyond traditional high-risk definitions: two winter storms across the central and eastern U.S., a record freeze that damaged citrus and other crops from the Florida Panhandle through South Florida, and severe rainfall-driven flooding in Hawaii.
Munich Re, applying a different loss threshold and a North America-wide scope, counts three winter storms between January and March that together caused nearly $11 billion ($7.7 billion of it insured) in total losses.
Risk is not just increasing, it’s changing shape
As our year-end report described, the shift in property risk is not only about more events or a changing peril mix; it reflects how losses are forming and behaving across perils. The peril profile below compares frequency and cost per event across two eras, and the first half of 2026 traced its arrows closely: Severe storms at high frequency and modest cost per event, winter weather and freeze pushing toward both higher frequency and higher cost, and flooding arriving more often at lower cost per event.
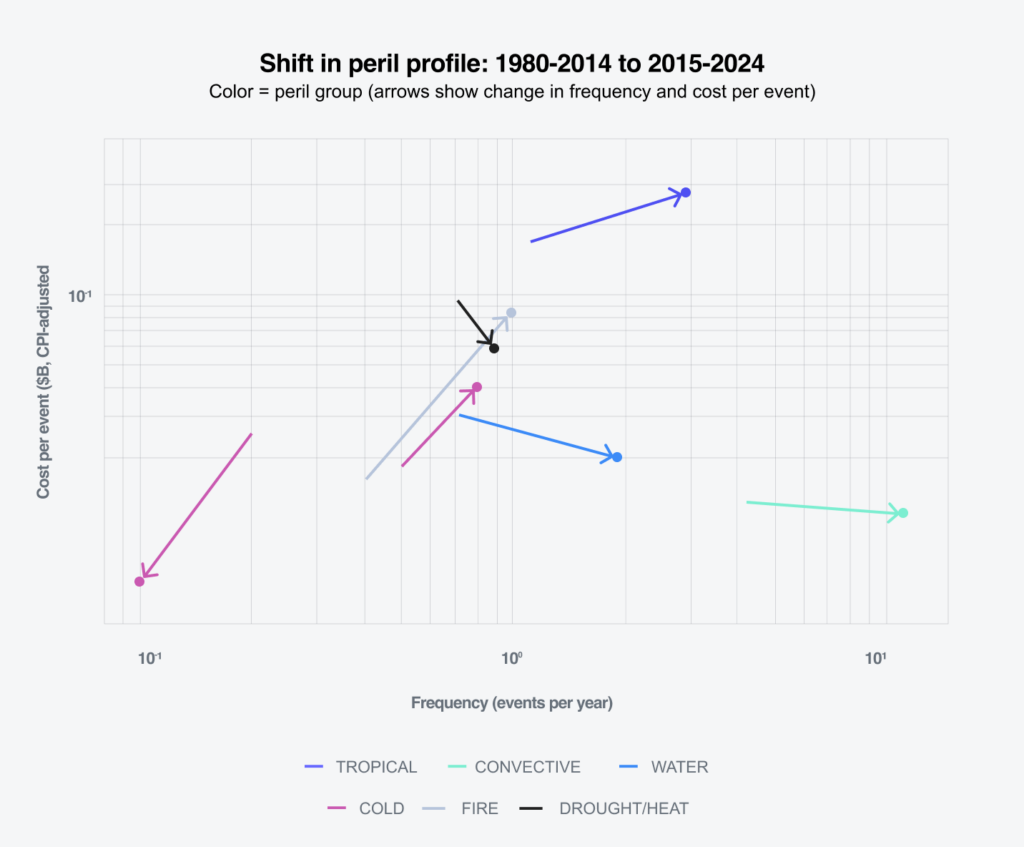
Shift in peril profile, 1980-2014 to 2015-2024 (frequency versus Consumer Price Index-adjusted cost per event). Carried from the 2025 year-end edition; refreshed annually. Source: NOAA/NCEI Billion-Dollar Weather and Climate Disasters (data set now maintained by Climate Central).
- Severe storms continue their multiyear trend toward higher frequency at lower cost per event — cumulative disruption rather than concentrated shock.
- Winter weather and freeze produced peak-season-scale losses in the opening weeks of the year, including significant commercial and agricultural exposure in regions where hard freezes are rare.
- Flooding arrived in March as sustained, record-heavy rainfall across Hawaii — a reminder that flood exposure extends well beyond the perils and regions that dominate annual planning and that damage can accrue where coverage is thinnest.
- Hurricanes remained absent through the half, apart from one June tropical storm (Arthur, still under assessment at the time of this report) — and 2025 saw no hurricane landfall in the continental U.S. for the first time since 2015 — but absence is not immunity, and the second half will test that distinction.
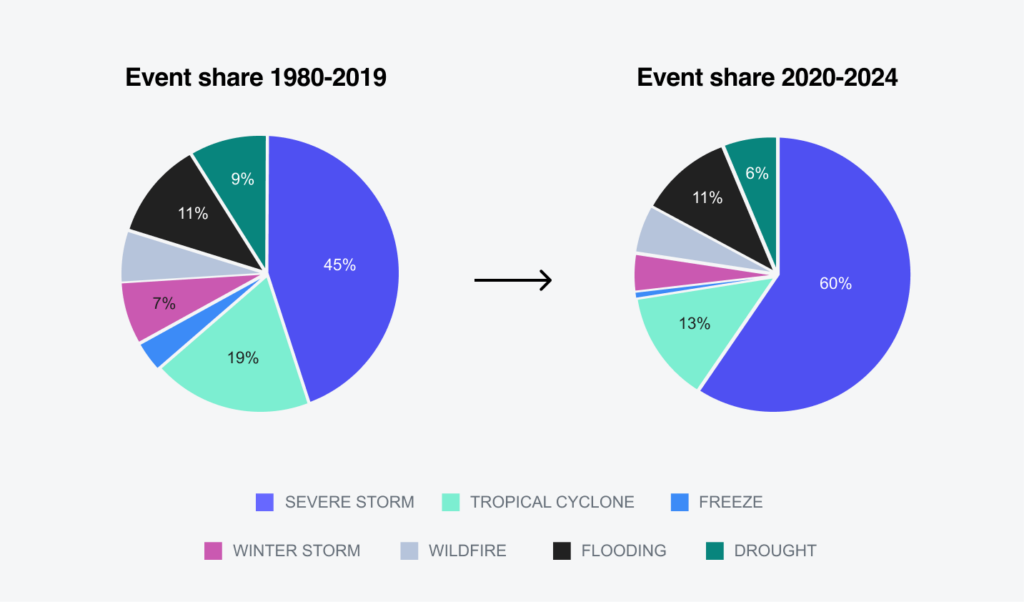
Share of U.S. billion-dollar disasters by peril, 1980-2019 (257 events) versus 2020-2024 (146 events). Severe storms rose from 45% to 60% of events. Source: NOAA/NCEI Billion-Dollar Weather and Climate Disasters (data set now maintained by Climate Central).
Translating market conditions into claim activity
12%
increase in new claim volume in FY 2026.
Our U.S. property loss adjusting data captured the inflection directly.
After bottoming in late 2025, new assignment volume rose roughly 12% in the first half of 2026 versus the prior half — the first half-over-half increase since the 2024 hurricane season — returning to within 2% of the level of a year ago. The reacceleration we anticipated at year-end materialized, but so far at a moderate scale.
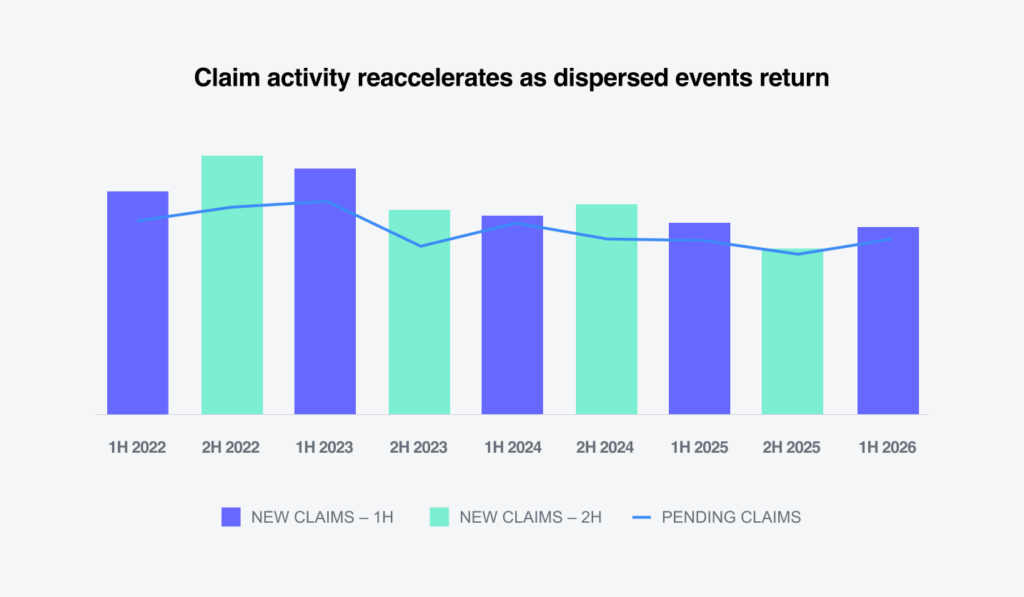
U.S. property new claims (bars) and pending inventory (line) by half-year, 1H 2022-1H 2026.
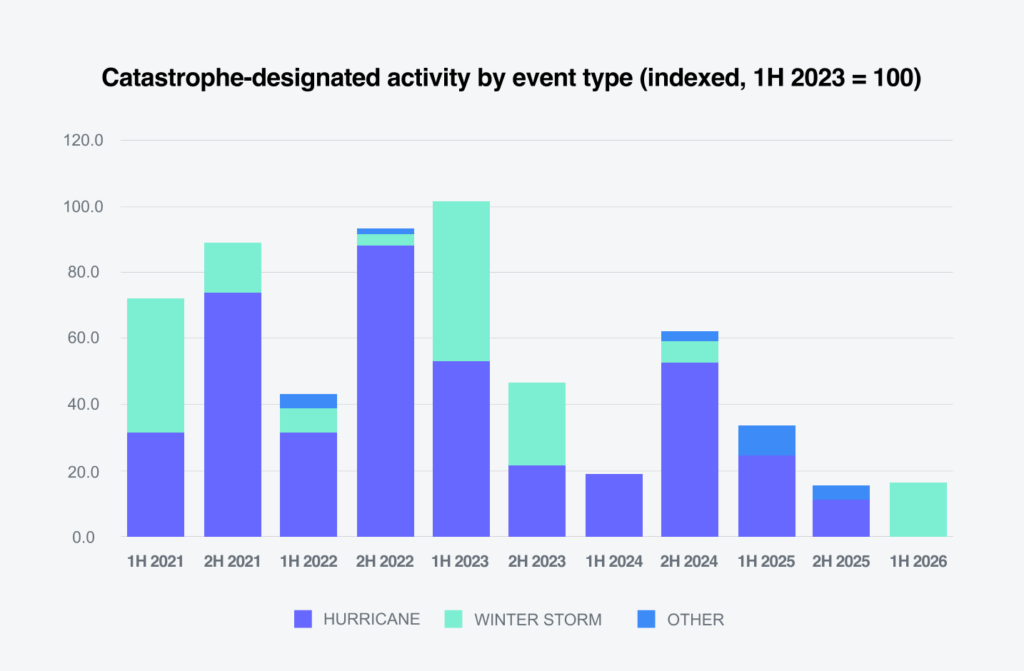
Decomposing that volume tells the sharper story. As part of our intake process, we segment claims into everyday demand (including routine weather activity) and catastrophe-designated response. In the second half of 2025, catastrophe-designated assignments all but disappeared — the quietest catastrophe period in recent years and leaving routine demand as the primary driver of activity. CAT activity returned in the first half of 2026, led by February winter storms that generated the largest catastrophe deployment of the period. The March-to-June convective run added substantial weather volume as well, but much of it moved through routine field and desk operations rather than formal catastrophe mobilization.
Even with that return, catastrophe-designated work represented only about 4% of intake across our U.S. loss adjusting operations — a narrower base than the total property volume charted above — and well below the shares recorded in the first half of 2023 and the second half of 2024, the two peak event halves of that cycle. The demand recovery, in other words, was real but mid-sized — mirroring the external event data almost exactly. The event mix tells the rest of the story: Catastrophe-designated activity in the first half of 2026 was composed entirely of winter storm events — the first period in our six-year series with no hurricane contribution to the mix — and ran at roughly half the level of a year earlier.
Pending inventory traced the same arc and demonstrated the operational discipline these conditions demand. Open inventory reached a multiyear low in December 2025, rose approximately 13% through March amid increased weather activity and eased through June to end the first half within 1% of the prior-year level. The March buildup was worked down, not carried forward, reflecting the ability to absorb higher claim volumes without expanding inventory. This is precisely the operating profile our year-end report argued these conditions would reward: the ability to scale through demand, not after it.
Beneath the aggregate, diversification continued to compound. Our TPA operations grew more than a third versus the prior half, with delegated authority volume especially strong. Marine and contents solutions have each roughly doubled since the first half of 2023, and forensic engineering demand strengthened alongside the return of event activity. The breadth of the platform — across field adjusting, desk solutions, specialty services and expert disciplines — continues to insulate overall demand from the volatility of any single line.
Claims impact: The first half validated the framework: Claim activity can rebound rapidly when weather events become more frequent. Organizations that invested in governance and segmentation during the quiet period entered 2026 more prepared, while those that assumed conditions would remain soft faced a steeper adjustment.
Why severity remains elevated
The severity picture did not soften with the pause, and it has not eased with the rebound.
Claim severity remains elevated across the property landscape, reflecting layered pressures that accumulate through the claim life cycle: labor availability and cost, materials and supply constraints, coverage adequacy, claim complexity, event characteristics and post-loss conditions.
- Labor availability and cost continue to extend repair timelines and increase settlement pressure, particularly in skilled and specialty trades — a constraint that tightens sharply whenever regional activity intensifies.
- Materials and supply dynamics remain volatile, with trade and tariff policy a continuing watch item for reconstruction costs.
- Coverage adequacy — higher deductibles, sublimits and uncovered perils — is creating friction between physical damage and recoverable amounts and continues to suppress claim formation for perils like inland flood.
- Freeze and winter events added a seasonal complexity dimension: Burst-pipe and business interruption losses in regions with limited hard-freeze building standards drive disproportionate severity per event.
Social inflation continues to act as a multiplier rather than a primary cause, extending resolution timelines in higher-severity and prolonged losses. Together, these pressures keep pushing the market toward adaptive claims models in which capacity, expertise and technology are deployed differently as conditions change.
Market response: Adaptive operations, proven in real time
The first half of 2026 was a live test of the adaptive operating model.
During the quiet opening months, carriers continued to handle a larger share of routine claims internally under tighter governance. When activity compressed into the March-to-June window, demand shifted rapidly toward surge capacity, field resources and specialty expertise — and back again as inventories cleared. The premium was not on standing capacity, but on the ability to flex without sacrificing control, consistency or policyholder experience.
Flexing without sacrificing consistency is ultimately a talent question. The March-through-June surge was absorbed by a bench that was built and maintained through the quiet period — field and desk adjusters, large loss specialists and cross-disciplinary experts across forensic engineering, accounting and building consulting, supported by our independent contractor resource platform. Sustaining that depth while volumes were falling was a deliberate counter-cyclical investment, and it’s the reason the inflection was absorbed rather than chased. Capacity can be added quickly, but judgment and experience take years to build. As a result, bench depth remains a critical differentiator when organizations come under pressure.
This reinforces the conclusion of our year-end report: The market question is no longer in-house versus outsourced or human versus technology. It’s continuous adaptation — aligning the right mix of internal capacity, trusted scalable partners and enabling technology to conditions as they evolve.
AI in claims: Adoption to governed scale
7%
of carriers report scalable success with AI tools in their operations.
AI is entering a new phase in insurance. The question is no longer what technology can do, but how carriers turn it into real, measurable value.
Industry analysis projects more than $100 billion in potential annual value from generative AI in property and casualty claims handling alone. Adoption itself is no longer the differentiator: While up to 82% of carriers now use AI tools in their operations, only 7% report achieving scalable success. The gap is not the technology; it’s the difficulty of integrating AI into existing workflows, systems and operating models while maintaining accuracy and oversight. Isolated pilots and point solutions improve individual tasks but trap data in silos and limit enterprise value.
Governance is becoming the gate
The regulatory landscape is formalizing quickly. As of mid-2026, more than half of U.S. states had adopted AI guidance modeled on the NAIC Model Bulletin, setting expectations for how carriers develop, monitor and govern AI-enabled decisions. Several states have gone further, issuing bulletins that address how existing insurance law applies to AI-enabled activities, with emphasis on governance, testing, oversight and audit readiness. Organizational preparedness lags the ambition: Roughly 70% of organizations have established dedicated AI risk committees, but only 14% report being operationally prepared to implement AI safely and effectively. Carriers that can demonstrate transparency and oversight now hold the clearest path to scale.
We hold our own deployments to that same standard. We maintain a dedicated AI governance committee, and our AI-enabled workflows are subject to formal review and oversight, with human judgment retained where decisions affect claim outcomes. As expectations continue to evolve, we’re committed to meeting a high bar for how AI is developed, monitored and applied in claims.
Amplifying expertise, not replacing it
Human-in-the-loop models have emerged as the preferred architecture. In one 2025 U.K. survey of claims handlers, 92% said human oversight must remain central to automated claims workflows. The role of AI is evolving from task automation to workflow orchestration: connecting information, decisions and actions across the claim life cycle so files keep moving, while adjusters focus on the work that requires judgment, like investigations, coverage analysis and guiding policyholders through difficult moments.
We’re deploying these workflows across our own operations, applying AI-assisted support where claims are routine and lower in complexity, while deliberately preserving experienced adjuster judgment for high-severity, non-standard and total loss scenarios. Pairing intelligent workflows with our market-leading bench of property expertise is where we see the durable advantage — and it’s how we’re building toward measurable gains in consistency, cycle time and policyholder experience.

The future of claims isn’t AI replacing adjusters. It’s combining world-class claims expertise with intelligent workflows to help professionals process information faster, make better decisions and deliver better outcomes at scale.”
David Guaragna
Managing Director of Property Operations, Sedgwick
Future considerations
90+%
chance of a very strong climate event through the 2026-27 fall and winter.
Near-term expectations
The second half of 2026 carries more uncertainty than the first. El Niño conditions have officially arrived, and the outlook has strengthened materially since early summer: The National Oceanic and Atmospheric Administration’s (NOAA) Climate Prediction Center now places the probability of a “very strong” event through the 2026–27 fall and winter at greater than 90%, up from 63% when the advisory was issued in June. Munich Re notes the quiet Atlantic season through June was consistent with El Niño conditions — while cautioning that powerful hurricanes still occur in El Niño years, with 1992’s Hurricane Andrew remaining among the 10 costliest tropical cyclones on record. They warn that a potential “Super El Niño” is likely to drive higher temperatures and extreme-weather effects across many regions in the second half. Reinsurers continue to caution that first-half results are not indicative of full-year outcomes. Historically, the costliest weather periods remain ahead, and a single major hurricane, wildfire or sequence of events can materially alter the loss picture.
A second consecutive season without a U.S. hurricane making landfall would be rare: It’s happened only twice since 1950 (in 1981-82 and 2000-01), and it’s the wrong planning assumption. The demand response to any renewed hurricane activity would land on a book already carrying elevated core volume, which is why we continue to invest in surge readiness: Our independent contractor resource platform, cross-disciplinary specialty bench, and the segmentation and escalation frameworks were refined through the recent quiet period.
Positioned for what comes next
The property claims landscape has entered its more dynamic phase, exactly as anticipated. The organizations best positioned for the second half of 2026 are those that treat readiness as a continuous state: flexible operating models, trusted scalable partners that flex alongside internal teams, and technology — now governed, orchestrated and human-centered — that supports speed and insight without replacing professional judgment.
The first half of 2026 rewarded readiness over forecasting precision. The pause ended, but the operating model held. The lesson is unchanged: In today’s property environment, success is not defined by the ability to predict every shift in demand, but by the ability to scale with confidence, deploy expertise where it creates the most value and deliver consistent outcomes as conditions evolve.
2026 MID-YEAR