

Our practice team uses JURIS claims data to perform comparative analyses informed by their expertise and analytics. The data in this report is based on both insured and self-insured claims for all states across five 12-month periods (referred to as FYs) from July 1, 2021, through June 30, 2026.
The auto liability environment presents a mixed picture. Several traditional performance indicators improved during FY 2026. Claim growth moderated, overall closure rates increased and the frequency with which bodily injury claims entered litigation remained relatively stable. Despite those favorable developments, financial pressure continued to build throughout the portfolio.
The reason is straightforward: Losses are becoming increasingly concentrated in a small number of severe claims.
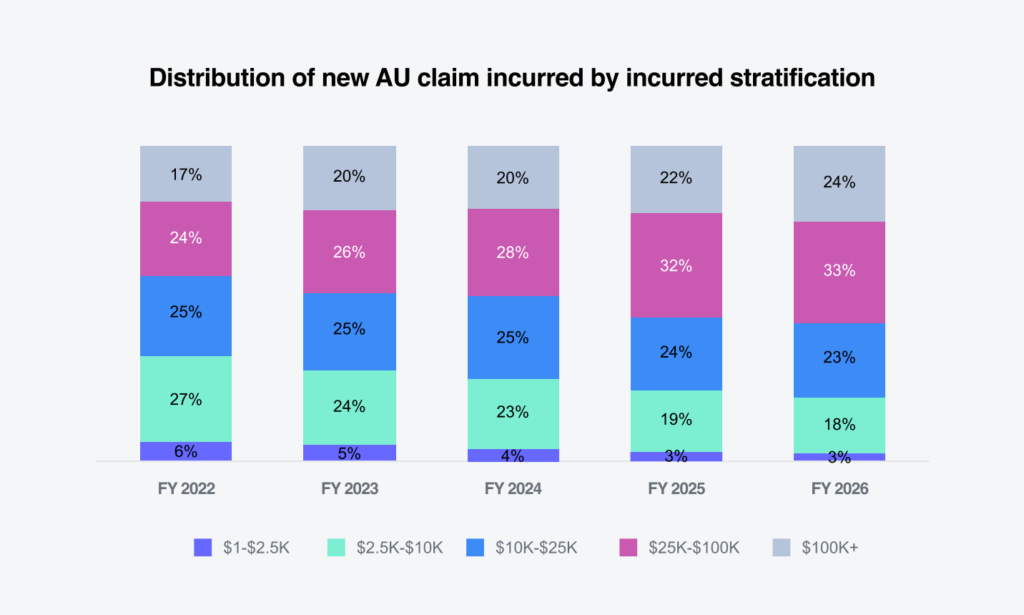
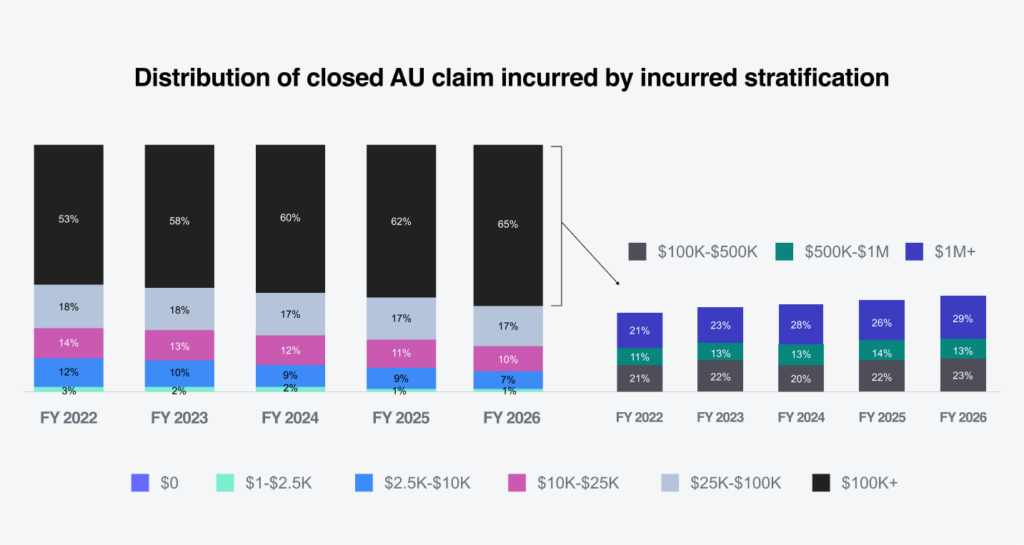
While claim counts continue to grow, overall portfolio performance is being driven less by frequency and more by the escalating cost of bodily injury, attorney involvement and litigation. Claims exceeding $100,000 represent only a fraction of total claim volume but account for nearly one-quarter of all incurred costs. Among closed claims, the same segment produces almost two-thirds of all incurred dollars. Likewise, litigated claims represent less than 4% of closed volume but generate more than half of all paid loss dollars.
The challenge is no longer to simply manage more claims. It’s identifying and influencing the relatively small number of claims that ultimately determine financial outcomes.
increase in auto liability claim volume in FY 2026.
increase in bodily injury (BI) claim volume.
increase in property damage (PD) claim volume.
Together, these represent a total of 71.8% of new claims and drive portfolio growth.
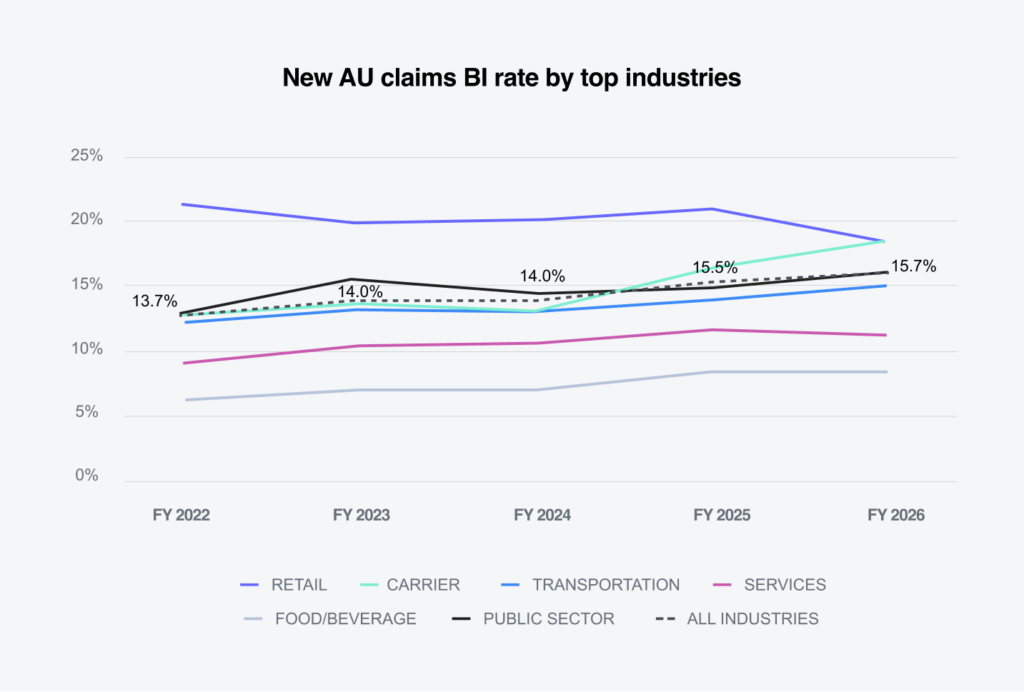
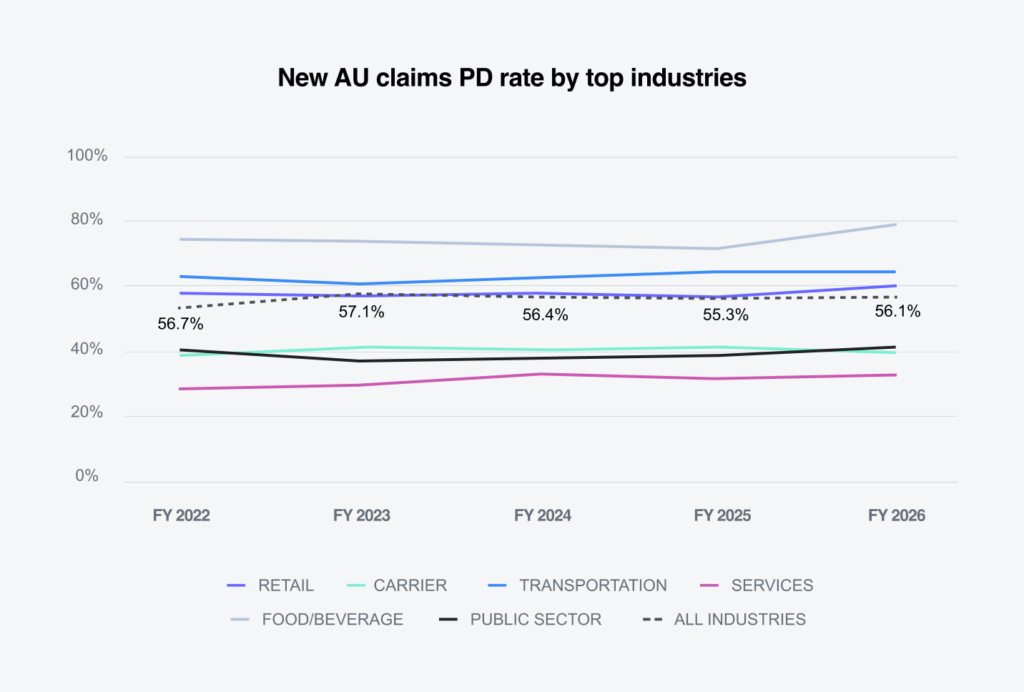
The food and beverage industry is seeing predominantly PD claims (81.2%), while retail and carrier maintain the highest BI rate at nearly 18%.
Geographic growth is concentrated in the Northeast. The five highest-volume states generated 43.8% of new claims.
New York and New Jersey recorded the largest FY 2026 increases (12.3% and 10.1%), well above California and Texas.
increase in average incurred for BI claims.
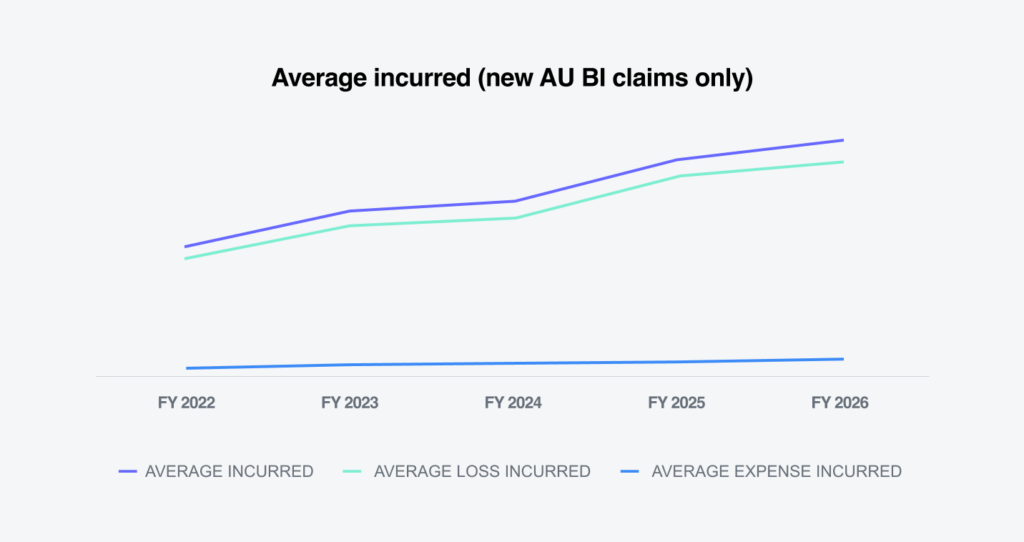
Overall incurred-cost growth slowed, but BI severity remains elevated. The average incurred increased 3.7% for all new claims, while BI claims are 8.6% higher.
of closed-claim dollars came from losses over $100K.
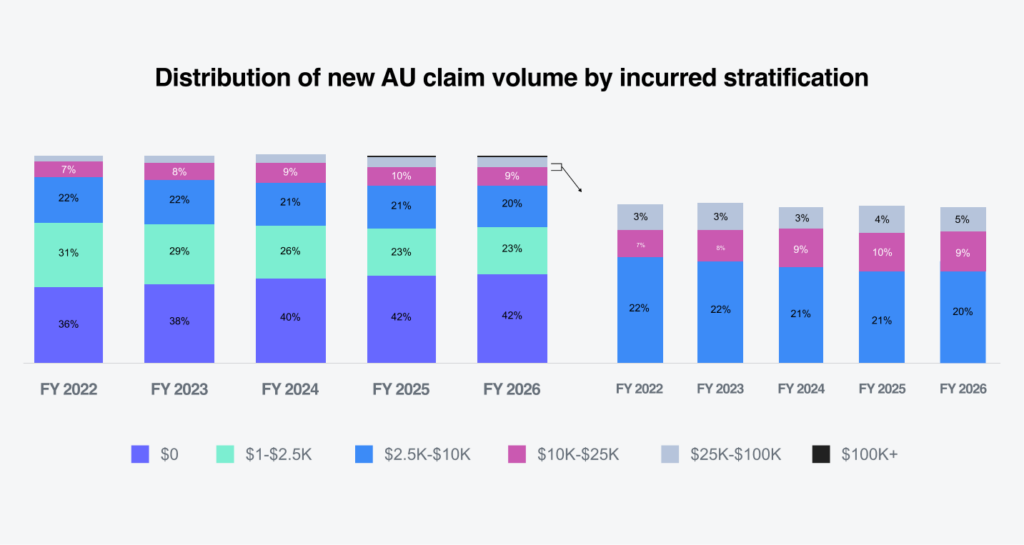
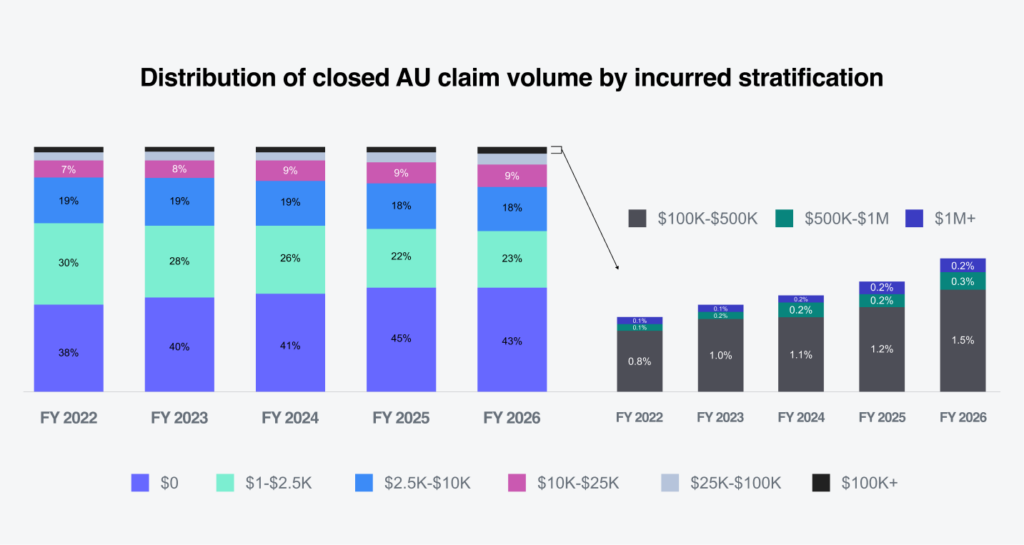
Large losses are consuming an increasing share of total dollars. Claims above $100,000 represented only 0.5% of new claim volume but 24% of all amounts incurred. Among all closed claims, the tier represented approximately 2% of volume and 65% of incurred dollars.
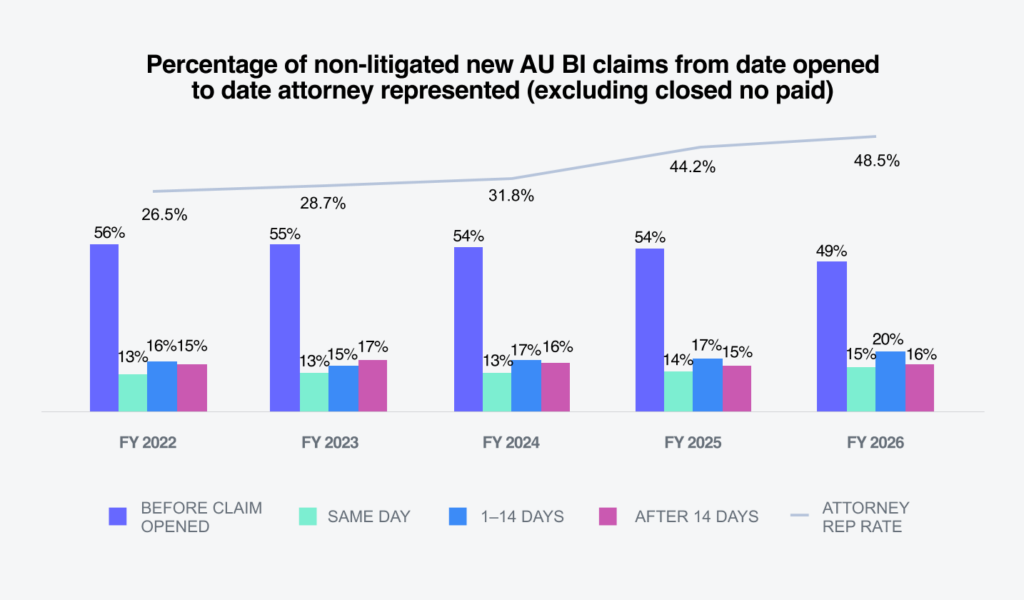
64% of BI claims that became litigated had representation within 24 hours, and 84% had representation within 14 days.
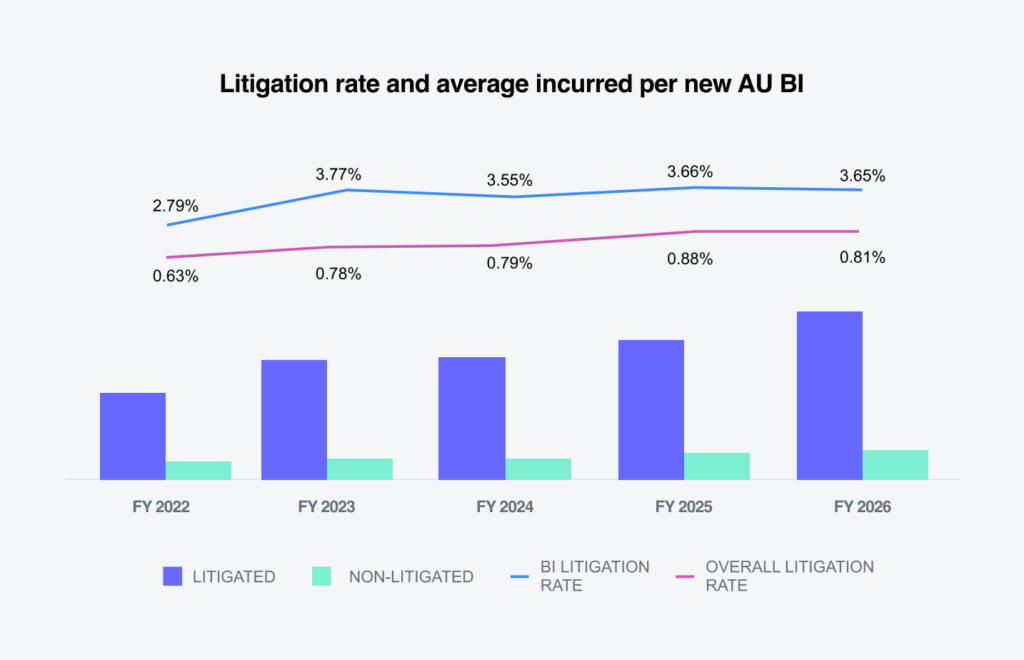
The new BI litigation rate remained mostly flat at 3.65%, yet average incurred on litigated BI claims increased 21.3%.
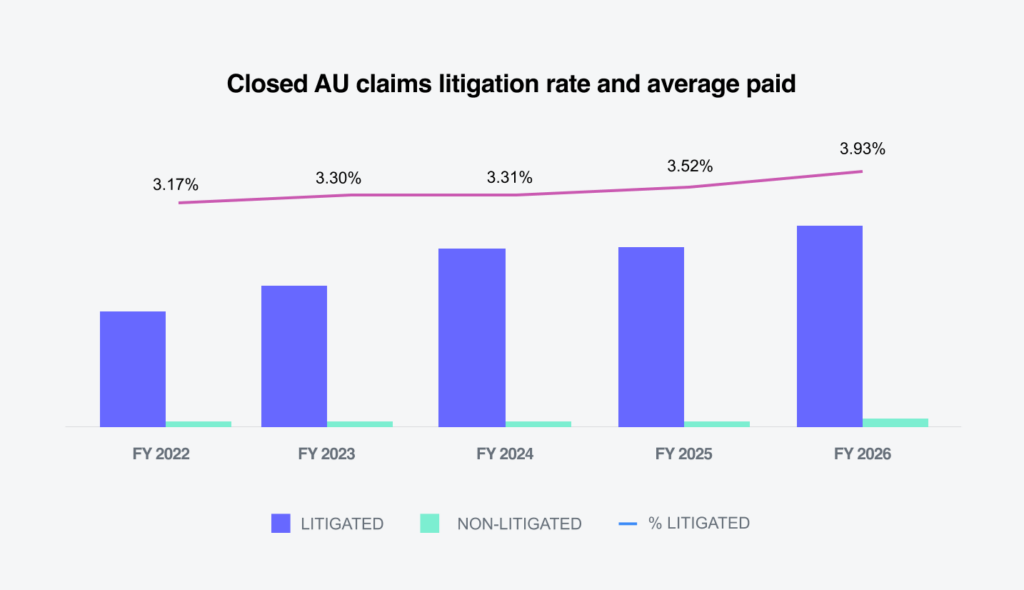
Pending litigation increased to 19.0%. Closed litigated claims represented 3.93% of closures but generated 53.6% of dollars paid.

Marsh
U.S. insurance rates. Marsh reported in its Global Insurance Market Index that U.S. commercial insurance rates decreased overall by 2% in Q2 2026. However, U.S. casualty rates increased 7%, following 9% increases in each of the prior two quarters.
AM Best
Rate increases have yet to restore profitability in commercial auto. In March 2026, AM Best maintained its negative outlook for the U.S. commercial auto segment, citing persistent loss-cost pressures as an ongoing constraint on underwriting results.
American Transportation Research Institute (ATRI)
Trucking insurance costs are decoupling from crash frequency. ATRI found that commercial-auto liability premium costs increased 18.6% between 2021 and 2024 to 10.2 cents per mile, outpacing consumer inflation by 5.4 percentage points — even while crashes involving heavy trucks declined 2.6%. This strongly supports a pricing narrative driven by severity and litigation, rather than frequency.
Verisk
A small number of severe BI claims now drives an outsized share of commercial auto losses. Verisk’s July 2026 analysis found that claims above $500,000 represented only 6% of commercial auto bodily injury claims but generated 45% of BI loss dollars from 2021 to 2025. As they noted, this understates the total economic impact because the data excludes loss adjustment expenses (LAE) and umbrella/excess losses.
CCC Intelligent Solutions
PD and BI severity are still compounding. CCC Intelligent Solutions reported that average paid BI severity rose 10.3% year over year and 32% over four years. Total losses reached a record 23.1% of claims, while 28.3% of repairable estimates included calibrations. This is evidence that advanced driver-assistance systems (ADAS) and vehicle technology continue to increase repair complexity.
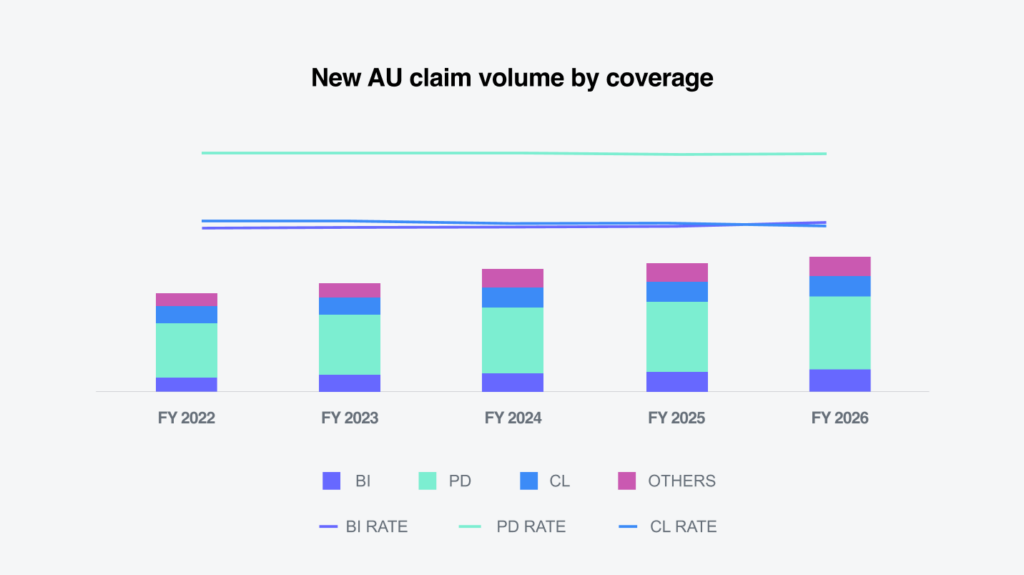
New claim volume increased 4% during FY 2026, continuing a four-year growth trend that has increased overall volume by approximately 36% since FY 2022. While annual growth has slowed compared to prior years, the portfolio is materially larger than it was only a few years ago.
More importantly, the growth is concentrated in BI and PD claims, which now account for nearly 72% of all reported losses. BI frequency rose again (5.8%) during FY 2026 and reached its highest level in the study period.
The growth in claims is not uniform across all industry groups. The rate of new BI claims was 15.7%, with both the retail and carrier industry groups slightly above the average. The overall PD rate increased in FY 2026 to 56.1% from the FY 2025 rate, with the food and beverage sector experiencing the highest PD rate of 81.2%.
Risk is becoming increasingly concentrated.
One of the most critical aspects in the portfolio is continued growth in the concentration of exposure. Historically, claim performance could often be improved through broad reductions in claim frequency. Today, overall results are increasingly determined by a much smaller population of severe claims.
The average incurred for all new claims increased 3.7% in FY 2026, significantly less than the 10% average annual rate of change since FY 2022.
Likewise, the average incurred for new AU BI claims in FY 2026 increased 8.6% over FY 2025, far below the average annual increase of 16% experienced since FY 2022.
As we’ve seen in previous years, the higher-tier groups are driving the overall increase in value. The $100,000-plus tier grew to 0.5% of new FY 2026 claim volume (0.4% in FY 2025) but generated 24% of all incurred dollars.
Among closed claims, the $100,000-plus tier represents approximately 2% of the overall volume and 65% of the total incurred value.
This is consistent with broader industry observations that a relatively small number of severe losses increasingly dictates outcomes.
A second notable trend is the increasing speed with which claimant attorneys are engaged. Among BI claims that eventually became litigated, nearly two-thirds involved attorney representation within 24 hours of first notice, while more than 80% obtained representation within the first two weeks.
Earlier attorney engagement continues to highlight that claim positioning increasingly occurs before a traditional claim strategy has fully developed.
The practical impact extends beyond litigation. Long before a lawsuit is filed, attorney involvement often influences medical treatment patterns, settlement expectations, documentation requirements and claim duration. In that sense, attorney representation has become an important leading indicator of future claim complexity.
The litigation rate has decreased slightly. For all new claims, the average litigation rate across all industries was 0.81%, a decrease from the 0.88% FY 2025 rate.
The cost of litigated claims continues to rise. The average incurred on new BI litigated claims increased 21.3% in FY 2026, while the average incurred for non-litigated new BI claims increased 6.1%. This represents a six-time variance between new BI litigated versus non-litigated claims.
The average paid on closed litigated claims increased 12.4% in FY 2026, equaling 28 times the average paid on non-litigated claims. Further, even though closed litigated claims represented only about 4% of all closed claims, they accounted for 54% of all closed paid amounts.
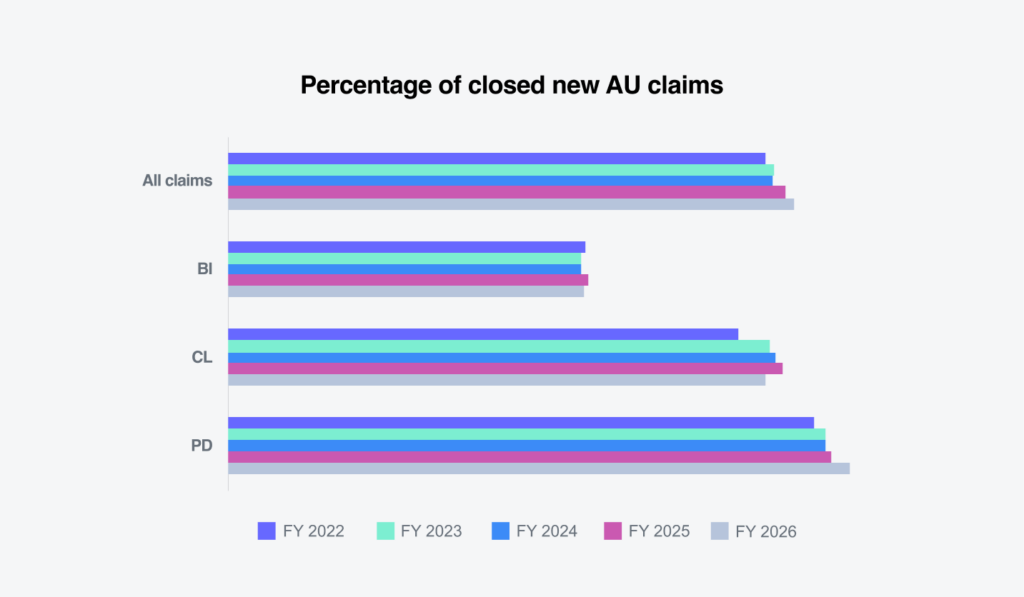
When it comes to new claim activity, prompt resolution must always be a focus. Closures for all new claims increased 1% in FY 2026, in comparison to FY 2025.
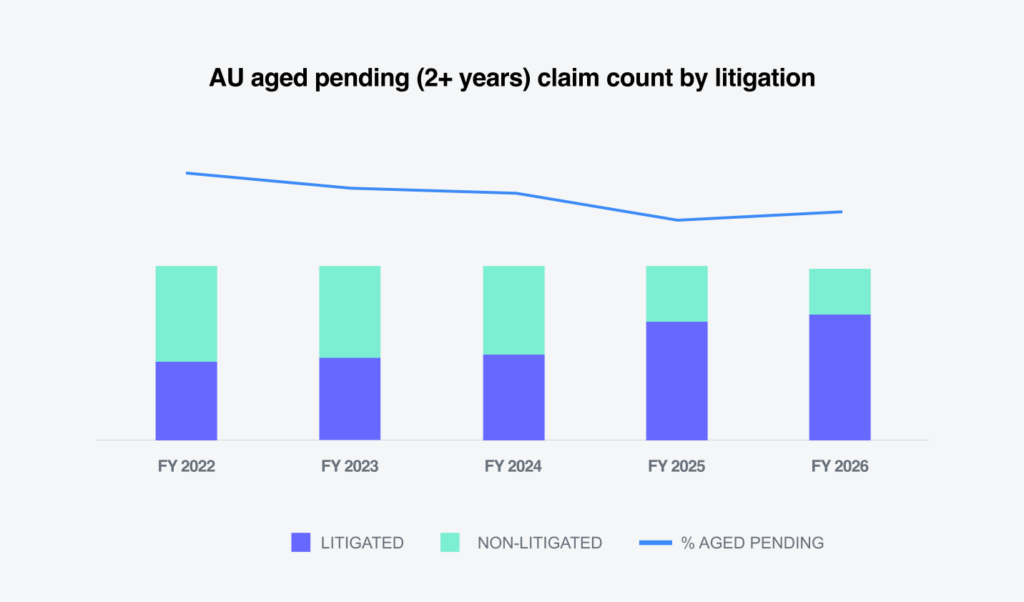
However, as already noted, litigation — especially among claims aged two or more years — continues to exhibit greater influence on outcomes. As a group, aged pending equaled 12.3% of overall pending in FY 2026. Although this represents an increase in aged pending as compared to FY 2025, the overall inventory remains well below the average for the previous five years.
Litigation continues to grow as a portion of overall aged pending, representing over two-thirds of this group.
Consistent with broader industry conditions, the auto liability data reflects several important considerations:
01
Claim growth is moderating, but the portfolio remains substantially larger. New auto claims increased 4.1% in FY 2026, a slower rate than in recent years but 36% above FY 2022.
02
Overall closure improvement doesn’t tell the full story. The increase in the closure rate was supported primarily by PD claims, while BI closures remained flat. There was a modest increase in claims pending two or more years, primarily driven by litigated matters — indicating that unresolved inventory is growing in complexity.
03
Financial exposure is increasingly concentrated in the tail. Claims exceeding $100,000 represented about 2% of closed claim volume but 65% of incurred dollars. Similarly, litigated claims represented only 3.93% of closures but accounted for 53.6% of amounts paid.
04
Early action has greater consequences. Of the BI claims that became litigated, 64% had attorney representation within 24 hours of first notice and 84% had it within 14 days. The focus remains on effective claimant engagement, liability assessment and escalation much earlier in the claim life cycle to ensure positive impacts on outcomes.
Evolving industry concerns
Several developments are expected to put continuing pressure on auto liability outcomes:
01
A compressed claim life cycle: Earlier attorney involvement, faster suit filing and greater use of time-limited demands are reducing the period available to investigate, communicate with claimants and establish a defensible resolution strategy.
02
Rising litigated severity, despite relatively stable new-claim litigation frequency: The new BI litigation rate remained mostly flat at 3.65%, but average incurred on new litigated BI claims increased 21.3%. The cost of litigated claims is a more significant concern than litigation frequency alone.
03
Settlement inflation influenced by perceived jury risk: Although very few litigated BI claims proceed to a final verdict, a combination of large verdicts, anti-corporate sentiment and plaintiff anchoring strategies continues to shape settlement expectations. Supporting litigation data indicates settlement severity has been increasing materially faster than verdict severity, creating “nuclear fallout” well beyond the small number of cases tried.
04
Expansion of third-party litigation funding: Funding was identified in 5.1% of year-to-date closed auto BI litigated claims, and funded cases had substantially longer durations than non-funded cases. Although concentrated in already complex claims and certain jurisdictions, funding may reduce settlement urgency, increase claimant risk tolerance and prolong high-severity matters.
05
Greater use of technology by the plaintiff bar and claimants: AI-enabled demand generation, rapid intake, shared intelligence and increasingly sophisticated correspondence are accelerating claim positioning. While these tools don’t change the underlying merits, they can compress response time and increase the importance of consistent triage, documentation and written defense advocacy.
06
Defense-side capacity and execution constraints: Claims staffing shortages, defense counsel capacity limitations and inconsistent negotiation governance may compound external severity pressures. In this environment, negotiation must be treated as a measurable technical discipline supported by data, training and clear authority.
07
Concentrated and shifting jurisdictional risk: Claim growth and severity remain disproportionately influenced by a limited number of states and venues. Tort reform may provide relief in select jurisdictions, but the environment remains fragmented and subject to legislative, judicial and political changes. Portfolio strategy should therefore remain venue-specific and not assume sustained, uniform reform benefits.
Claim growth has slowed, closure volume has improved and the frequency of new litigation has remained relatively stable. However, those favorable indicators are offset by a heavier bodily injury mix, increasing attorney representation, a growing litigated pending inventory, renewed aging and sharply concentrated tail severity.

The most significant shift is that claim severity is increasingly being created before a traditional litigation strategy is fully developed. Attorney representation, demand anchoring, external litigation funding and procedural pressure can establish claim expectations early, while the influence of large verdicts extends well beyond the small number of cases that reach trial.

Sustainable improvement in the auto liability space will depend less on indiscriminately closing more claims and more on improving the timing and quality of claim decisions. Focusing on enhanced engagement, realistic valuation, disciplined reserving, jurisdiction-specific strategies, structured negotiation, active management of counsel and credible trial readiness can help to improve overall outcomes. This positive influence will be driven by strategies like: