
2026 MID-YEAR

General liability

Report Objectives

This report aims to summarize the present metrics for our general liability (GL) programs, assess the landscape of GL claims and litigation, and benchmark our patterns against comparable industry research.

data parameters

Our practice team uses JURIS claims data to perform comparative analyses informed by their expertise and analytics. The data in this report is based on both insured and self-insured claims for all states across five 12-month periods (referred to as FY 2022 through FY 2026) from July 1, 2021, through June 30, 2026.  

Executive summary

The general liability environment remains defined by a paradox: Claim frequency is relatively stable, but severity continues to accelerate. The data shows that a small percentage of claims are responsible for a disproportionate share of total loss costs.

At the same time, attorney involvement continues to occur earlier in the claim life cycle. By the time many organizations first make meaningful contact with an injured claimant, counsel has already been retained. This compressed timeline reduces opportunities for early resolution and contributes to increased litigation counts, costs and severity.

The implication is clear: Future outcome improvements will be driven by identifying, engaging and resolving the relatively small population of claims most likely to become litigated and severe.

1.8%

increase in GL claim volume in FY 2026.

15.2%

increase in average paid.

2.3%

of new claim volume was valued above $25,000 and represented nearly 58% of all incurred dollars.

11.4%

increase in average incurred.

0.3%

of new claim volume was valued above $100,000 and represented nearly one-quarter of all incurred dollars.

Download a summary slide with these key observations.
Report contents

Market

The Baldwin Group

General liability remains a casualty market outlier. Despite broad commercial market softening, U.S. GL pricing increased 4.5% in Q2 2026, moderating from 6.1% in Q1 and 9.3% in Q4 2025.

Casualty Actuarial Society

Liability claim severity continues to outpace economic inflation. An Insurance Information Institute/Casualty Actuarial Society analysis estimates that inflation added $88 billion-$108 billion to general liability losses and defense and cost containment expenses between 2015 and 2024 — approximately 27%-34% of booked losses. Other liability-occurrence severity grew at a 6.8% annual rate, compared with 3.2% for the Consumer Price Index (CPI), confirming that severity — not claim frequency — is the dominant pressure.

Aon

Nuclear verdicts, organized plaintiffs’ activity and third-party litigation funding remain structural rather than cyclical challenges. Aon reports that GL and commercial auto nuclear verdicts increased 52% in 2024 and total awards more than doubled. Additionally, the average lead limit offered by umbrella carriers has fallen to $10 million from $20 million in 2019.

AM Best

GL profitability and reserve adequacy remain under pressure. Even as aggregate property and casualty (P&C) results improve, AM Best still maintains a negative outlook for general liability. They cite adverse development in current and prior accident years, elevated social inflation costs and a 120% combined ratio for other liability-occurrence in 2024.

Marsh

Capacity is available but increasingly selective. This is particularly true in umbrella and excess layers. Marsh reports Q2 2026 U.S. casualty rates were up 7%, or 11% excluding workers’ compensation — with risk-adjusted umbrella/excess rates up 15%. Some insurers are capping individual risk capacity at $10 million, unsupported or standalone umbrella capacity remains constrained, and higher attachment points are increasingly common for large fleets and risks in litigation-heavy jurisdictions.

Volume trends

1.8%

increase in new claims in FY 2026.

Frequency remains manageable.

General liability claim frequency remains relatively stable. Total new claims increased 1.8% in FY 2026, continuing a modest five-year growth trend averaging approximately 1.2% annually.

Growth was almost entirely driven by property damage (PD) claims, which increased 5.6% year over year. Bodily injury (BI) frequency was essentially unchanged.

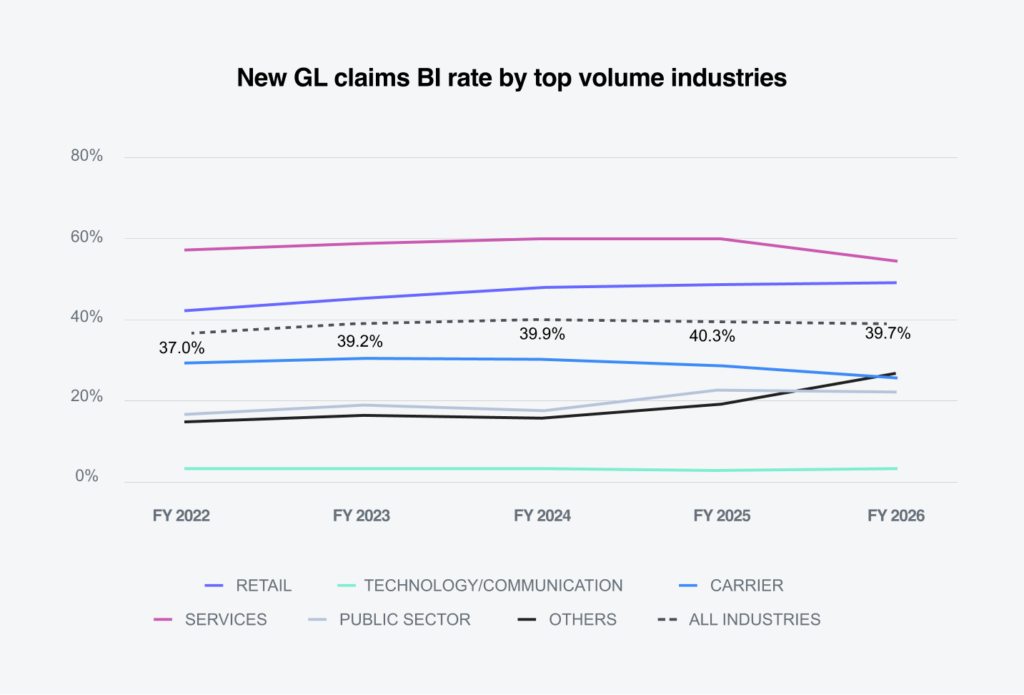
For the fifth year in a row, the sectors with the highest rates of GL BI claims were the services and retail industries, at 55.7% and 50.0%, respectively. However, retail decreased 5.9% from FY 2025. The overall average BI claims rate was 39.7%, which decreased by just 0.6% over FY 2025. 

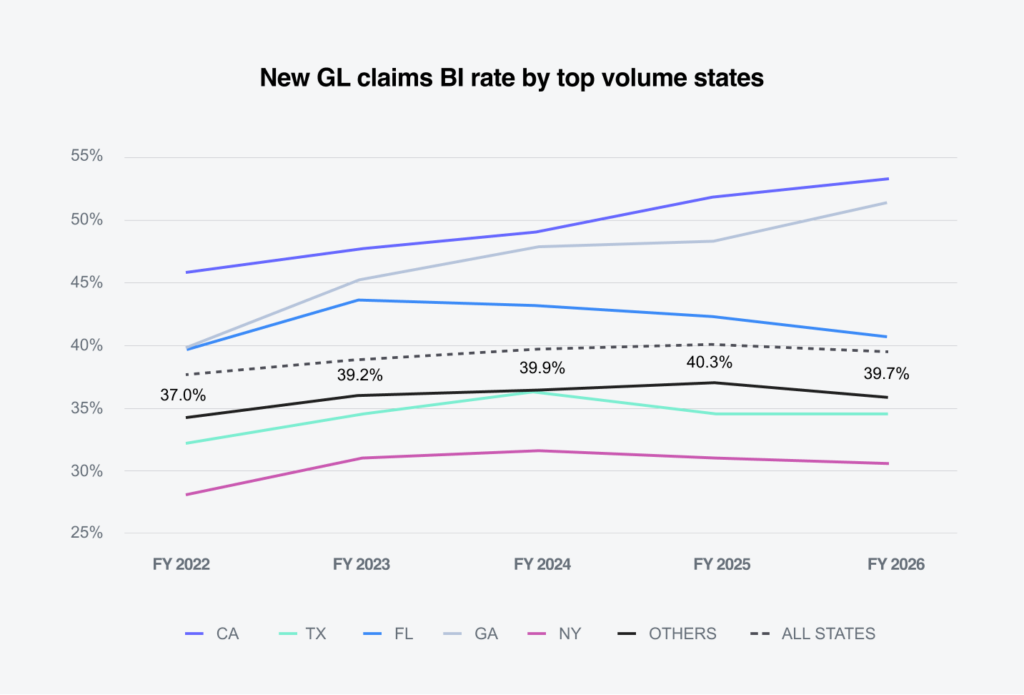
California (54.2%), New York (52.4%) and Florida (41.7%) had new GL BI claim rates above the nationwide average (39.7%). Two states that recently passed comprehensive tort reform, Florida (-0.6%) and Georgia (-0.5%), both saw rates go down, with Florida experiencing three consecutive years of decline.

Severity outpaces frequency

15.2%

increase in average paid in FY 2026.

Costs are rising faster than exposure.

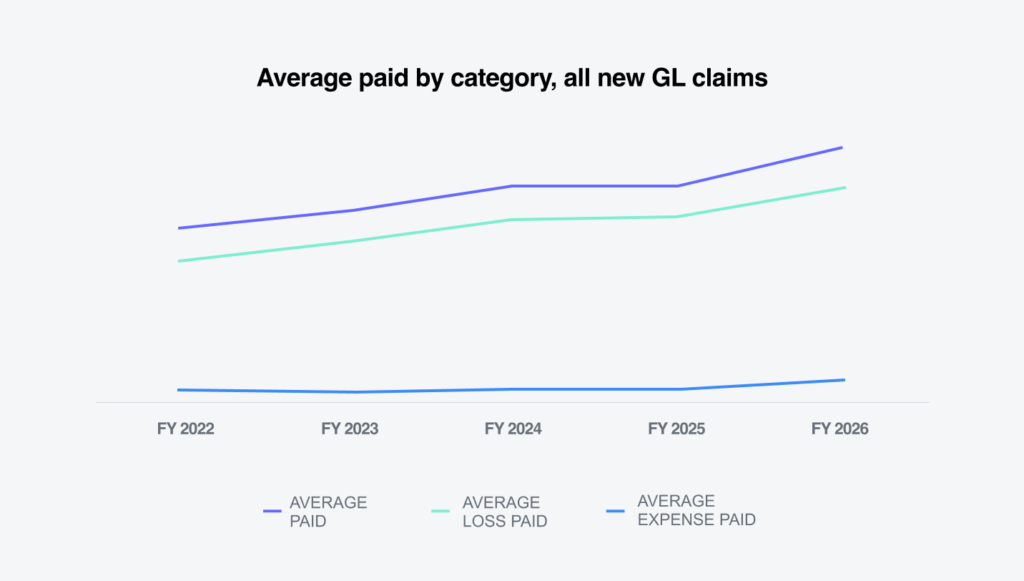
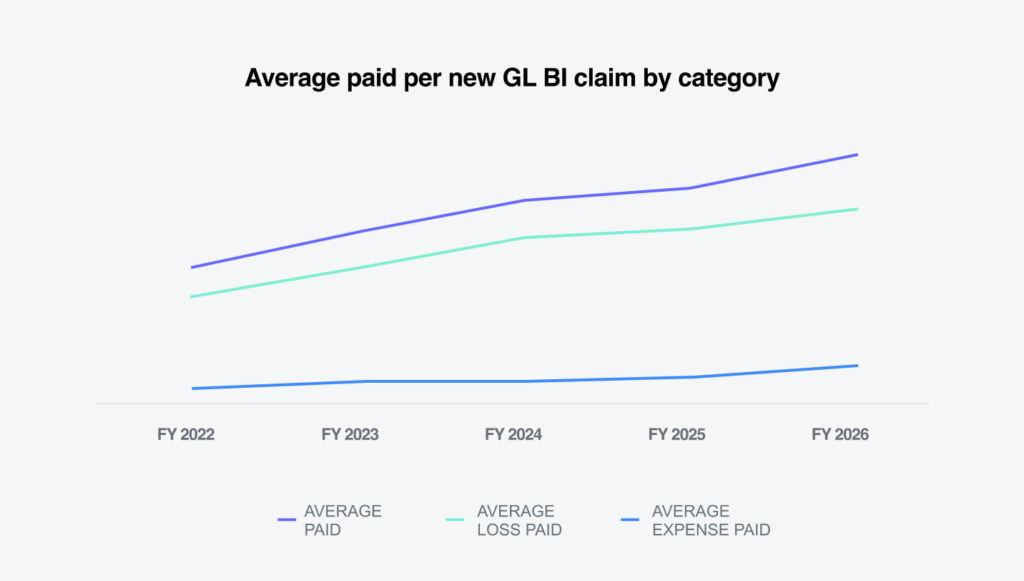
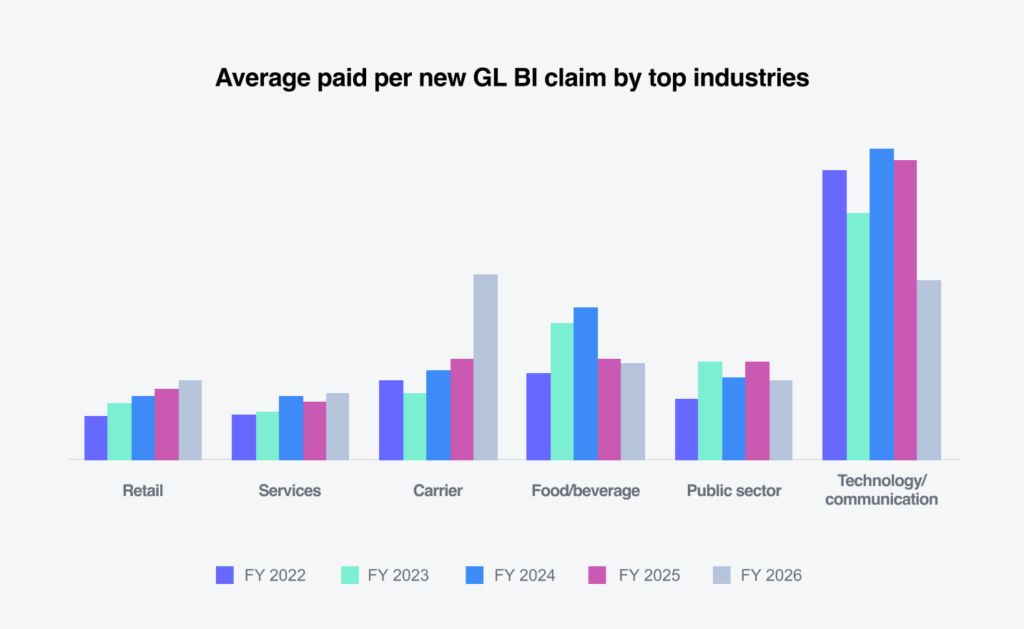
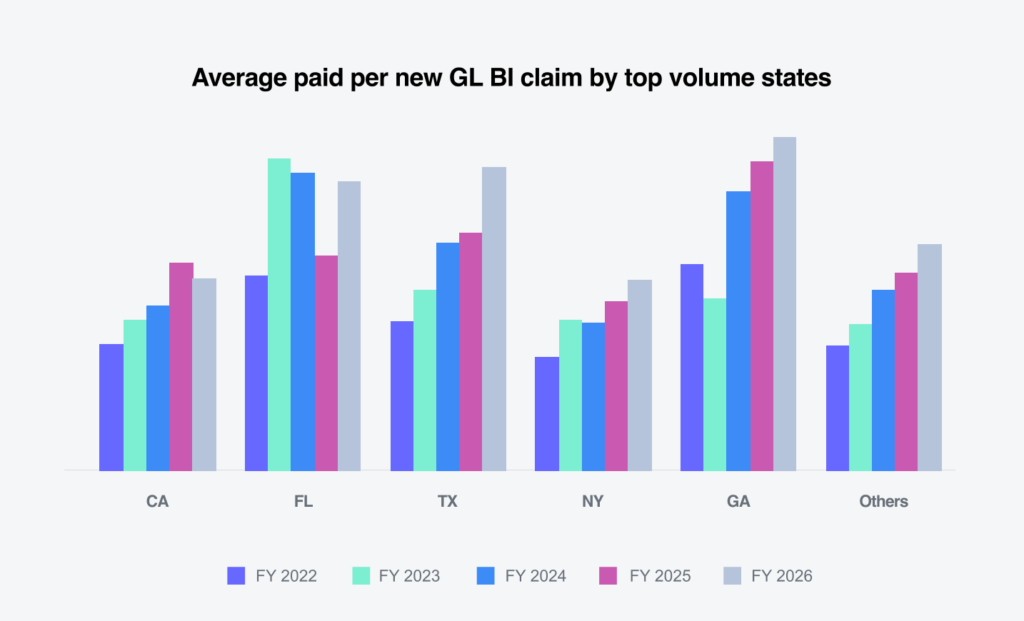
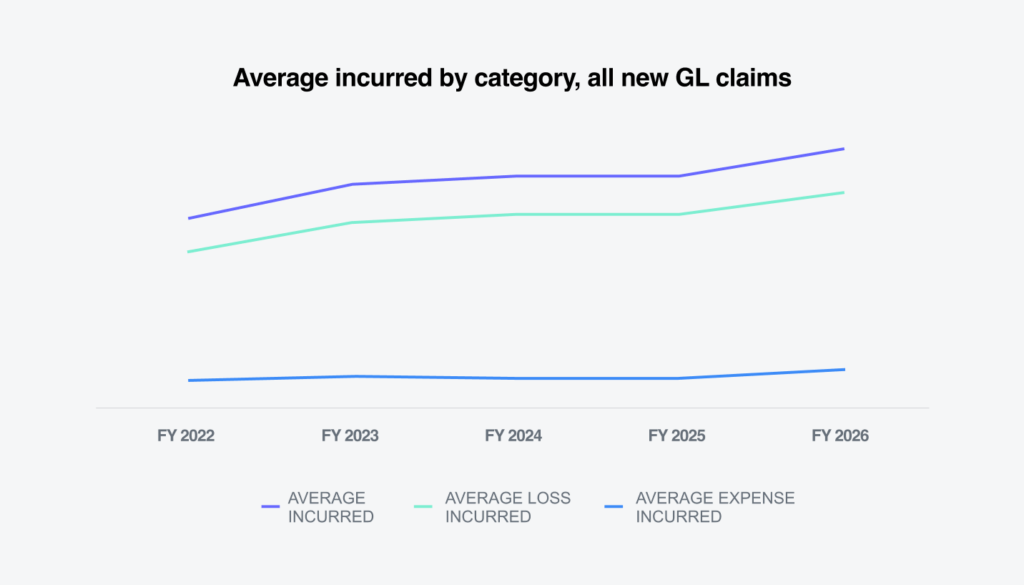
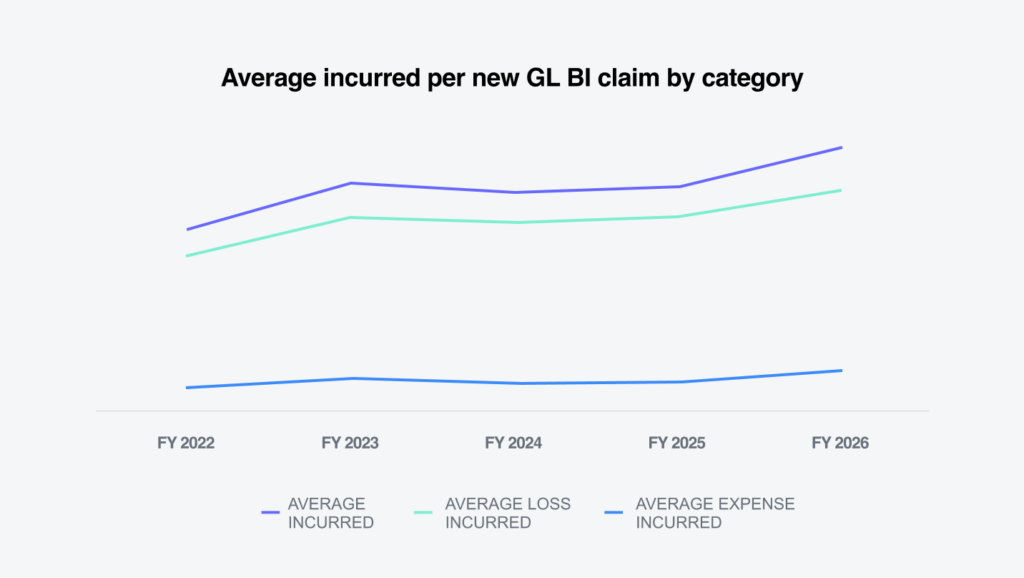
The most important trend here is visible in the paid and incurred severity charts.

While claim volume increased by less than 2%, the average paid for all new GL claims increased 15.2%. This was driven by a 13.7% increase in the average loss paid, while the average expense paid increased 25.6%. For BI claims, the average paid increased 14.0%, and the average loss paid increased 10.2%. The average annual increase in average paid has been 14.9% since FY 2022.

The average paid per new GL BI claim rose in the retail (14%), carrier (84%) and services industry (14%) categories. The increase in retail average paid is more impactful and represents the effects of social inflation, medical inflation and plaintiff bar tactics.

Florida experienced the largest increase in average paid for new GL BI claims at 35%, with Texas (27%) and Georgia (8%) also seeing increases. California (-9%) experienced the largest decrease. Florida’s 2023 tort reform appears to have materially reduced BI paid severity, but that benefit is offset in 2026 by ongoing medical and social inflation, along with litigation severity. All other states collectively experienced an increase (16%) consistent with the largest states. The nationwide average annual percentage change (AAPC) has been 14.9% since FY 2022.

The average incurred loss for all new GL claims was up 11.4% in FY 2026, compared to FY 2025. The increase occurred in both average loss incurred (9.5%), as well as average expense incurred (21.8%). 

The average incurred for new GL BI claims increased 17.1% over FY 2025. The AAPC for incurred new GL BI claims has been 10.2% since FY 2022 — more than three times the rate of inflation during the same period. 

The gap between claim frequency and cost suggests that outcomes are becoming progressively more expensive, regardless of claim count.

Several factors are contributing to this trend:

  • Rising medical costs
  • Increased defense and litigation expense
  • Higher plaintiff expectations
  • Larger settlement values
  • Growing attorney involvement
  • Continued impact of social inflation

Outcome concentration

58%

of new GL total incurred was for claims over $25K.

A small number of claims is driving most of the cost.

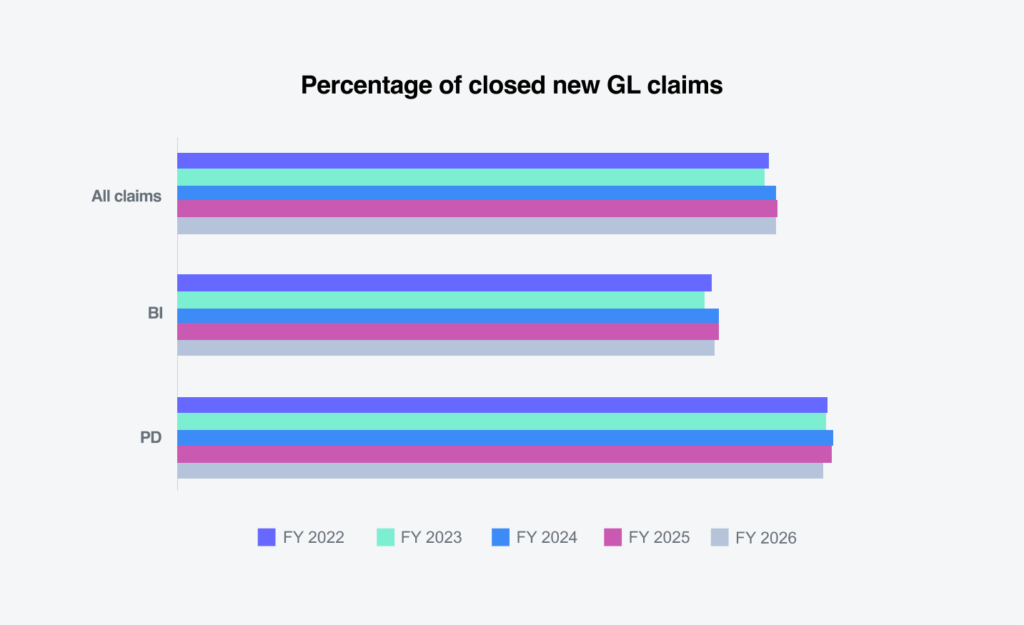
Overall, liability closure rates for new FY 2026 claims remained high.  

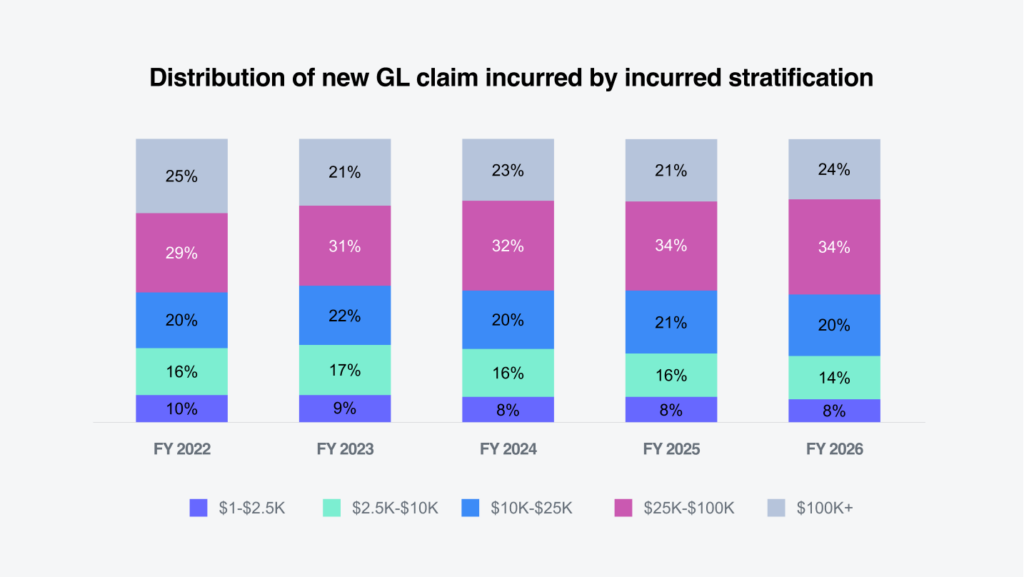
The incurred stratification provides critical insight into what’s driving this and the types of claims that remain open beyond the initial year.

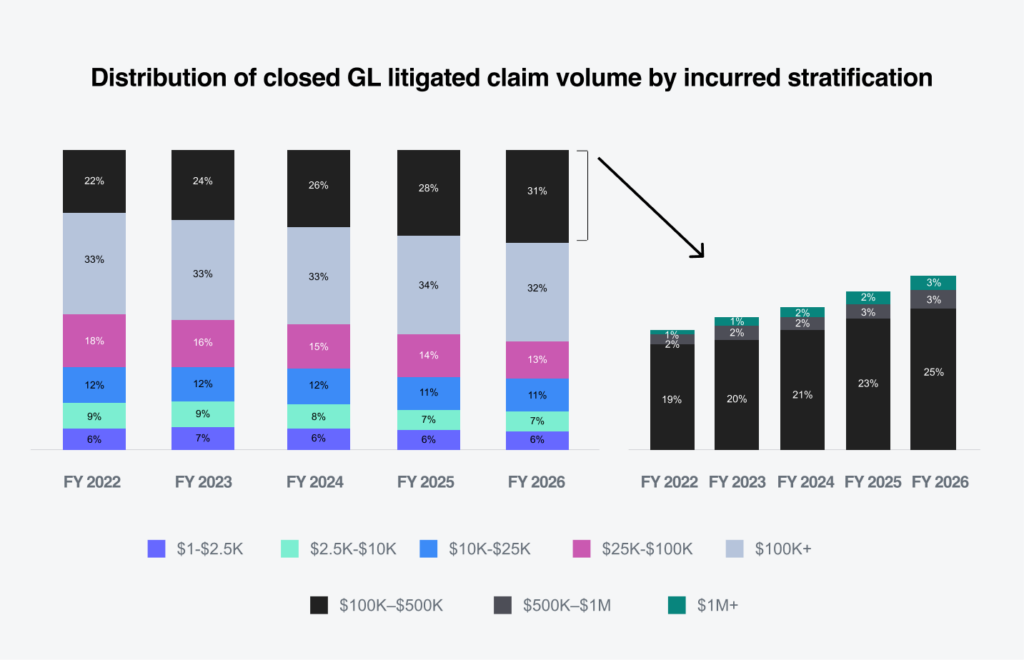
The $100,000-plus tier for GL claims increased by 3% to 24% of the total incurred, while representing only 0.3% of new claim volume. The $25,000-$100,000 tier remained at 34% of the total incurred, while representing 2% of new claim volume. That means claims at $25,000 and above represent 58% of the total incurred for new GL claims.

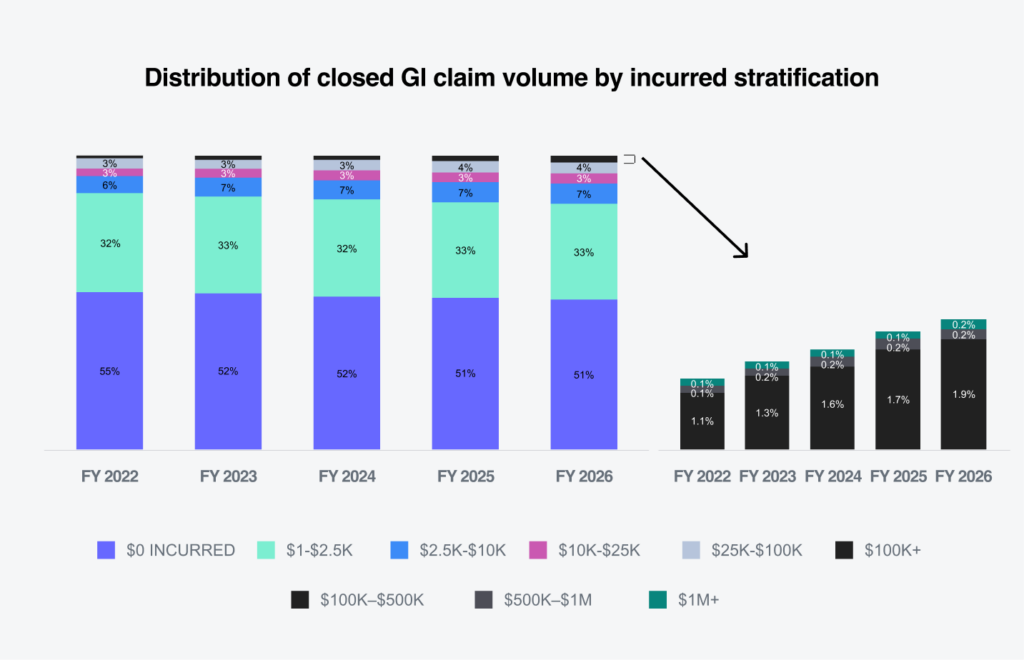
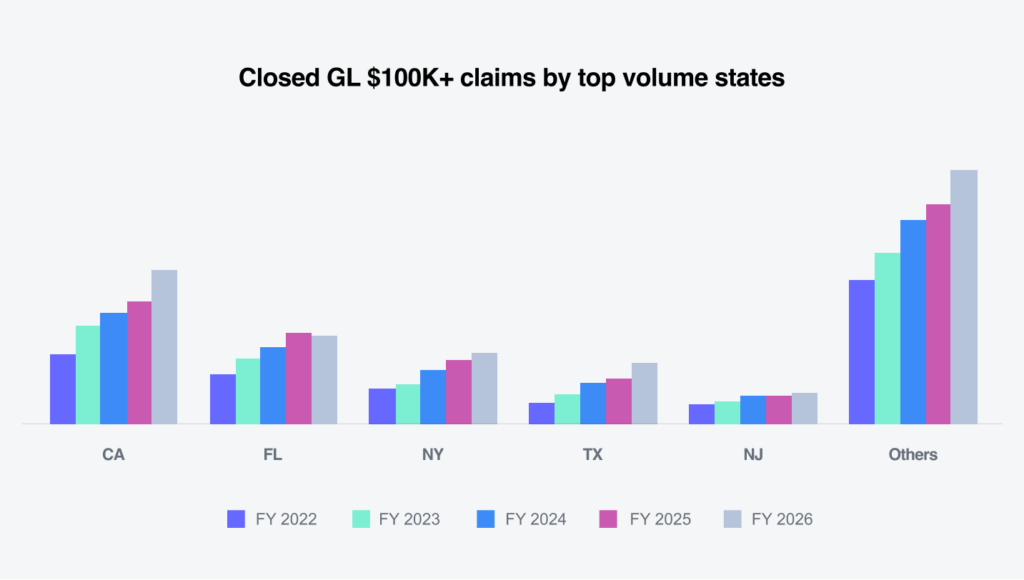
Additionally, the higher-tier incurred groups have seen increases in overall closed GL claim volume for five years, with the highest tier ($100,000-plus) accounting for 2.3% of all closed GL claims. That same tier accounts for 76% of the total incurred.  

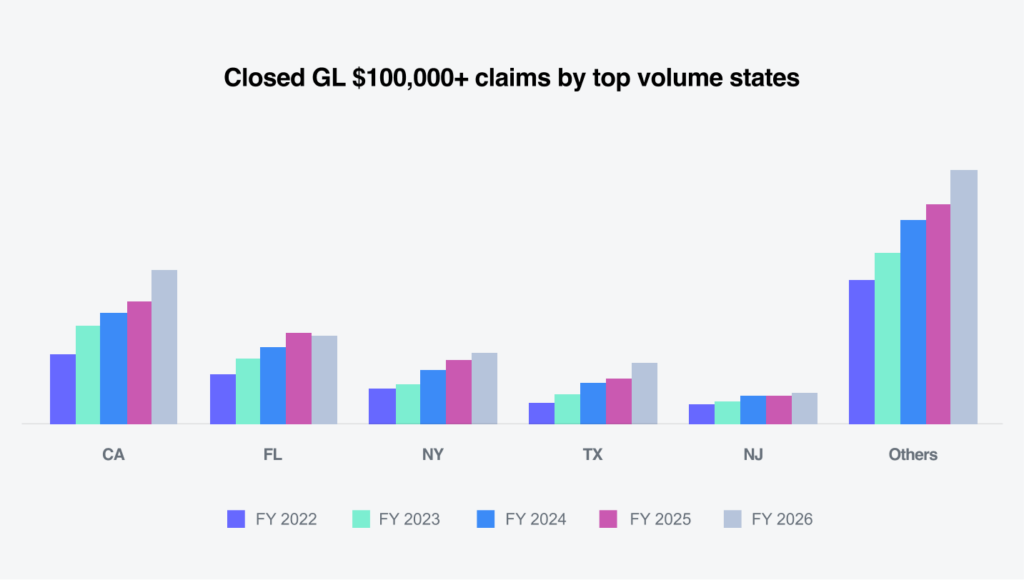
California, which represents 23.4% of all $100,000-plus closed GL claims, increased 26% over FY 2025. The largest increase occurred in Texas (35.1%), but the state represents only 9.3% of these claims nationwide. California, along with Florida (13.3%) and New York (10.7%), are the top volume states nationwide in the $100,000-plus tier.

This claim concentration confirms that results are increasingly determined by a very small subset. Workflows focused on identifying severe claims early and managing them carefully, coupled with appropriate resources, provide the best avenue for improving outcomes.

Attorney involvement

67%

of litigated new GL claims had attorney representation within 24 hours.

The window for early resolution is shrinking.

The attorney representation data reveals a significant change in claimant behavior with regard to litigation.

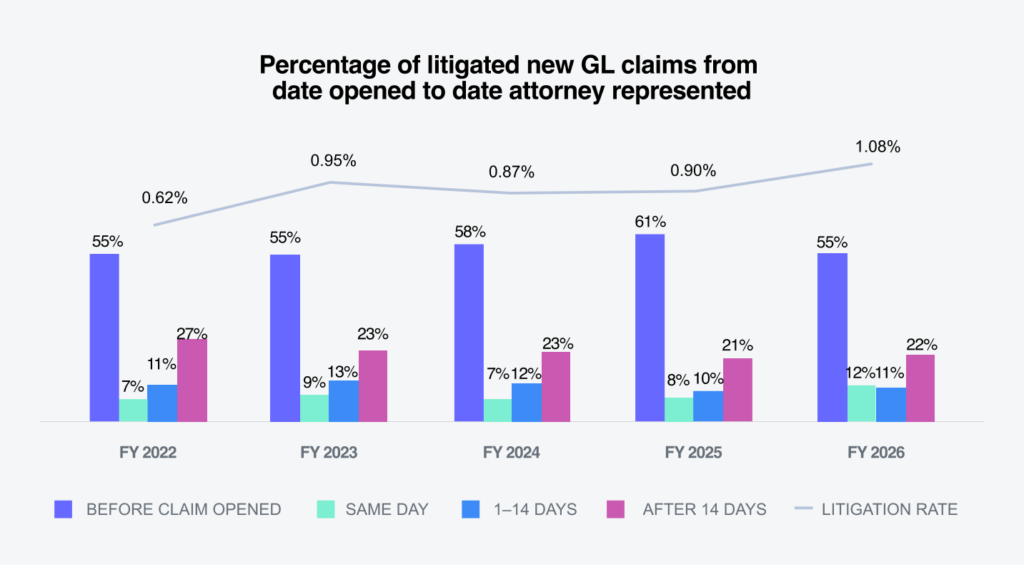
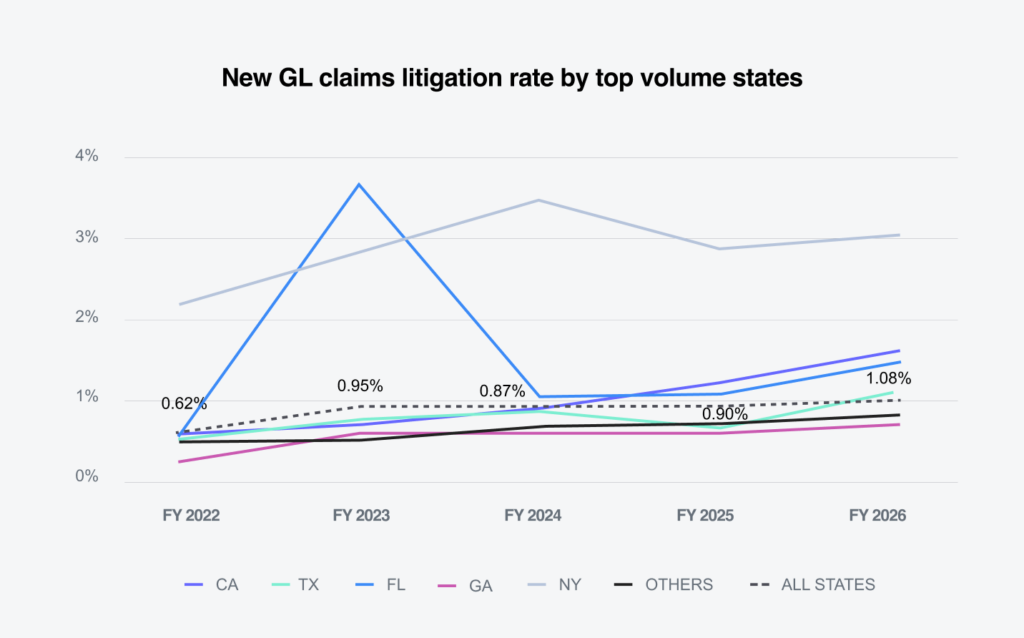
In FY 2026, the litigation rate for new GL claims increased slightly to 1.08%. The data shows a continuing trend of more aggressive attorney representation rates, with 67% of litigated new GL claims having attorney representation within 24 hours of the claim being opened and 78% within 14 days of the initial report.

This trend matters because claims involving representation are more likely to have:

  • Longer durations
  • Higher investigation costs
  • Greater litigation propensity
  • Higher settlement values

Practically, this means there’s a compressed time period in which examiners can influence the trajectory of developing high-exposure losses without an attorney being involved.

Litigation remains the largest outcome driver.

Although litigated claims represent only a small percentage of all volume, they continue to drive a disproportionate share of total cost.

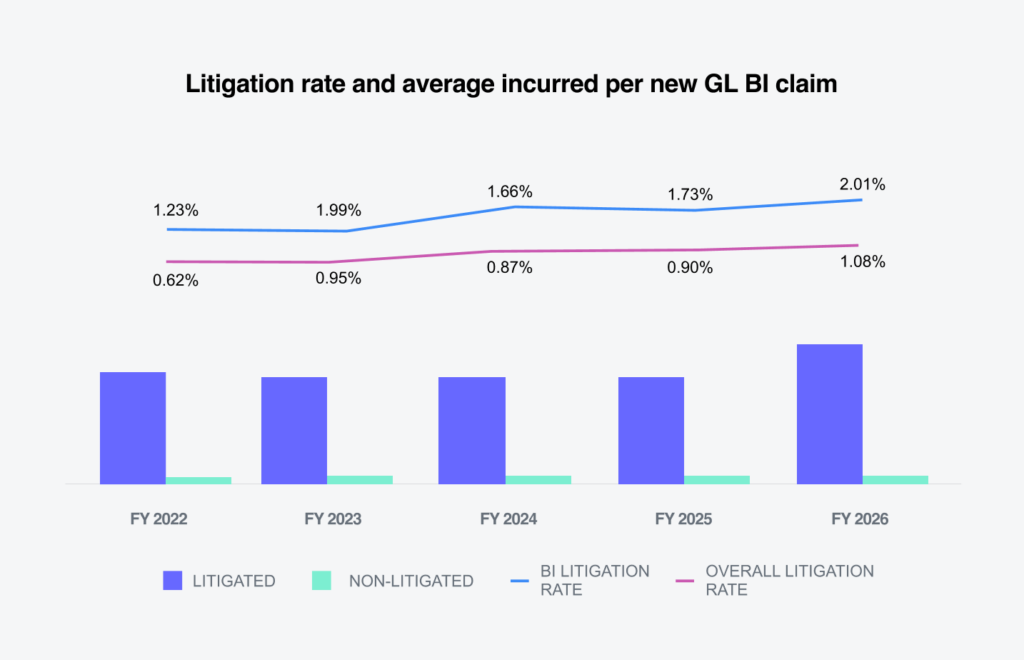
The litigation rate for new GL BI injury claims increased slightly in FY 2026 to 2%. Note the continued large variance in average incurred values between litigated and non-litigated claims.

Closed litigated GL claims increased to 5.69% of all closed claims and accounted for 67% of the total dollars paid. The average paid for a litigated claim increased 15.3% in FY 2026, while the average paid on non-litigated closed GL claims increased 9.3%. The cost of closed GL litigated claims was 33 times more than that of closed GL non-litigated claims.

Additionally, litigation is becoming more concentrated among the claims that matter most financially. 

Litigated claims now represent a separate risk category requiring specialized oversight, counsel management, negotiation strategy and executive visibility.

Location matters more than ever.

Not all jurisdictions behave the same. The state analyses reinforce the importance of venue-specific strategies.

New York’s new GL litigated claims rate was 2.83%, compared to the national average of 1.08%. California (1.54%) and Florida (1.41%) also had new GL litigated claim rates exceeding the national average, while Texas equaled the national average at 1.08%.    

Together, California, Florida, Texas and New York represent a disproportionate share of high-severity claims.

Considerations

Sedgwick’s data reflects a general liability environment in which claim frequency remains comparatively manageable but severity, legal involvement and expense are increasing much faster than claim volume.

01

Severity, not frequency, is the principal challenge. New GL claim volume increased 1.8% in FY 2026, while average paid increased 15.2% and average incurred increased 11.4%. This divergence indicates that traditional claim-count measures alone no longer represent portfolio risk.

02

Financial exposure is concentrated in a small population of claims. Claims valued at $100,000 or more represented only 2.3% of closed volume but 76% of total incurred dollars. Similarly, litigated claims represented 5.69% of closures but 67% of paid dollars, with an average paid amount 33.8 times that of non-litigated claims.

03

Earlier attorney involvement is becoming a reliable severity indicator. 67% of litigated claims had attorney representation within 24 hours of the initial report and 78% within 14 days. This continues to materially reduce the window for direct claimant engagement and early resolution.

04

Litigated inventory requires differentiated management. Average incurred on pending litigated GL claims increased 17.3%, compared to a 1.3% decrease for non-litigated pending claims. This divergence supports an approach that segments litigated, attorney-represented, aging and high-severity claims into distinct workflows, rather than managing them with standard processes.

05

Jurisdiction and venue remain critical risk variables. New York, California and Florida exceeded the national litigation rate, and the growth in $100,000-plus closures was particularly pronounced in California and Texas. Claim strategy, reserving, counsel selection and settlement authority should reflect local venue conditions, rather than national averages alone.

Evolving industry concerns

Several developments suggest that liability severity is increasingly created before a claim reaches trial — and often before a conventional litigation strategy has been fully developed.

01

A compressed liability life cycle: Earlier attorney representation, accelerated suit filing, time-limited demands and elevated opening demands are moving consequential decisions closer to first notice. Claims organizations have less time to investigate, evaluate liability and damages, establish reserves and define a credible negotiation posture.

02

Settlement inflation in the shadow of nuclear verdicts: Trials remain rare, but outsized verdicts influence expectations across the broader claim population. Our liability analysis found that settlement severity increased at an average annual rate of 12.6% over the past five years — more than three times the 3.7% annual increase in verdict severity. The greater portfolio concern may therefore be the effect of perceived trial risk on routine settlement behavior, rather than the verdicts themselves.

03

Third-party litigation funding as a severity multiplier: Funding remains concentrated in a relatively small number of already complex claims. In our data, funded GL BI cases averaged 11.1 times longer in duration, while total incurred on funded litigated GL claims increased 232% since 2022. External capital can reduce settlement urgency, extend litigation and alter traditional assumptions about negotiation leverage.

04

Growing plaintiff-side technology and information advantages: Plaintiff law firms are using data, automation and AI to accelerate intake, generate more sophisticated demands and coordinate litigation strategies. AI-generated communications styled as legal correspondence are also appearing from unrepresented claimants. Although presentation does not change the underlying merits of a claim, it can accelerate escalation and requires claims professionals to distinguish substance from form.

05

Defense capacity and execution gaps: Claims staffing constraints, defense counsel capacity, inconsistent data capture and uneven negotiation training may limit the defense’s ability to respond at the speed now required. Negotiation must be treated as a structured discipline supported by data, written advocacy, defined authority and clear alignment between claims professionals and counsel.

06

An uneven and potentially fragile tort reform landscape: Reform may moderate particular behaviors in selected states, but benefits remain jurisdiction-specific and subject to judicial interpretation, legislative change and adaptation by the plaintiffs’ bar. Venue intelligence and local strategy will remain necessary, even where reform appears favorable.

Conclusions

The FY 2026 results show that general liability risk is increasingly defined by the concentration and acceleration of severity, rather than broad-based increases in claim frequency.

A small group of litigated and high-value claims accounts for a disproportionate share of financial outcomes, while attorney representation and jurisdictional differences are creating greater complexity earlier in the claim life cycle.

This environment requires a shift from generalized cost control to targeted outcome control. Early identification of litigation propensity and severity, immediate claimant engagement, realistic reserving, venue-specific strategy and timely escalation should occur before positions become entrenched. For litigated claims, activity alone is not sufficient; each file should have a current liability and damages assessment, a defined negotiation or trial strategy, appropriate settlement authority and a measurable path toward resolution.

Organizations best positioned to control volatility will connect claims expertise, legal strategy, analytics and operational discipline. Technology can help identify the small population of claims most likely to drive loss, but experienced judgment remains essential in determining how and when to intervene. The objective is not simply to close more claims; it’s to resolve the right claims at the right time and on the most defensible terms.

2026 MID-YEAR

© 2026 Sedgwick